
Coordinates, Bar Chart, Dilation, Piecewise Functions, Expected Value Demo
Loading the math board and drawing, please wait…
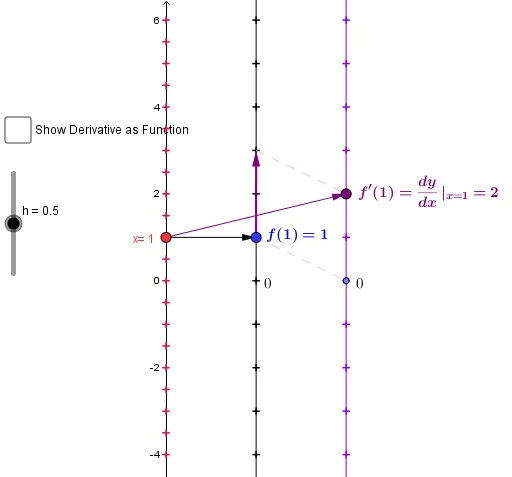
This example demonstrates how to create bar charts using coordinates in GeoGebra, and shows the effect of dilation transformations on piecewise function graphs, while calculating expected values. Core math concepts include coordinate geometry, bar chart creation, dilation transformations, properties of piecewise functions, and expected value computation in probability statistics. Key construction steps involve using commands like Point, Vector, Segment, Line, Derivative, Intersect, Sequence, Zip to build graphics, and sliders for dynamic visualization. Suitable for high school mathematics teaching, focusing on function transformations and statistical calculations.
GeoGebra Commands & Parameters
Point(yAxis) → AVector(A, B) → f_vTextfield(f) → inputBox1Vector(x_1, y_1) → vSegment(f_x, F) → cSegment(E, F) → dSegment(A, x_1) → eSegment(B, y_1) → gSegment(B, y_1) → h_1Line(x_1, y_1) → iLine(A, B) → kTextfield(f) → inputBox2Derivative(f) → f'Vector(B, C) → uLine(C, D) → bIntersect(b, k) → FocusLine(x_1, y_1) → nLine(A, B) → pIntersect(n, p) → GSequence(n, n, -10, 10) → numZip((2, n), n, num) → n_yZip((4, n), n, num) → z_hVector(A, H) → wSegment(f_x, E) → mPoint(q) → JSegment(B, J) → rPoint(B, u) → KSegment(K, H) → sZip((0, y(A) + (h * c)), c, num) → x_hZip((2, f(y(A) + (h * c))), c, num) → y_hZip(Vector[(0, y(A) + (h * c)), (4, f'(y(A) + (h * c)))], c, num) → df_hZip(Vector[(0, y(A) + (h * c)), (2, f(y(A) + (h * c)))], c, num) → f_hZip((y(A) + (h * c), f'(y(A) + (h * c))), c, num) → ptdf_h
AI Drawing Prompt Reference
Create a coordinate system with a bar chart and a piecewise function graph, demonstrating the effect of dilation transformations and calculating expected values. Start by drawing the axes and origin, then construct the bar chart based on input function values. Use points, vectors, segments, and lines to build the piecewise function graph, with sliders for dynamic parameter adjustment. Finally, compute and display the expected value, ensuring all elements clearly show the mathematical relationships.
The prompt above was compiled from the original drawing commands and is for reference only.