
Coordinates #6: Points, Trace, and Statistical Intervals
Loading the math board and drawing, please wait…
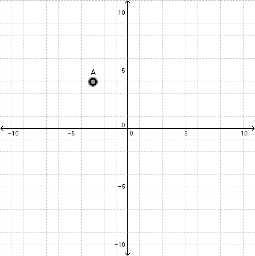
①This GeoGebra example demonstrates the interplay between coordinate geometry and basic statistics by using points A and B with trace enabled, alongside a histogram, right triangles, means, and confidence intervals. ②Core mathematical concepts include Cartesian coordinates, point tracing, arithmetic mean, histogram representation, right triangle properties, and the visual interpretation of confidence intervals. ③Construction highlights: the example employs GeoGebra commands to define points A and B, activate the trace feature, and create an auxiliary object A_1 (likely a derived point or statistic), allowing dynamic dragging to observe how coordinate changes affect statistical summaries like the mean and confidence interval. ④It is suitable for middle or high school mathematics and introductory statistics courses, helping students connect coordinate geometry with data distribution and interval estimation in a visual, interactive way.
GeoGebra Commands & Parameters
Point A(-3, 4)((2 * x(A)), 0)Boolean trace(false)A + (0, 2)