
Contour Plot and Surface
Loading the math board and drawing, please wait…
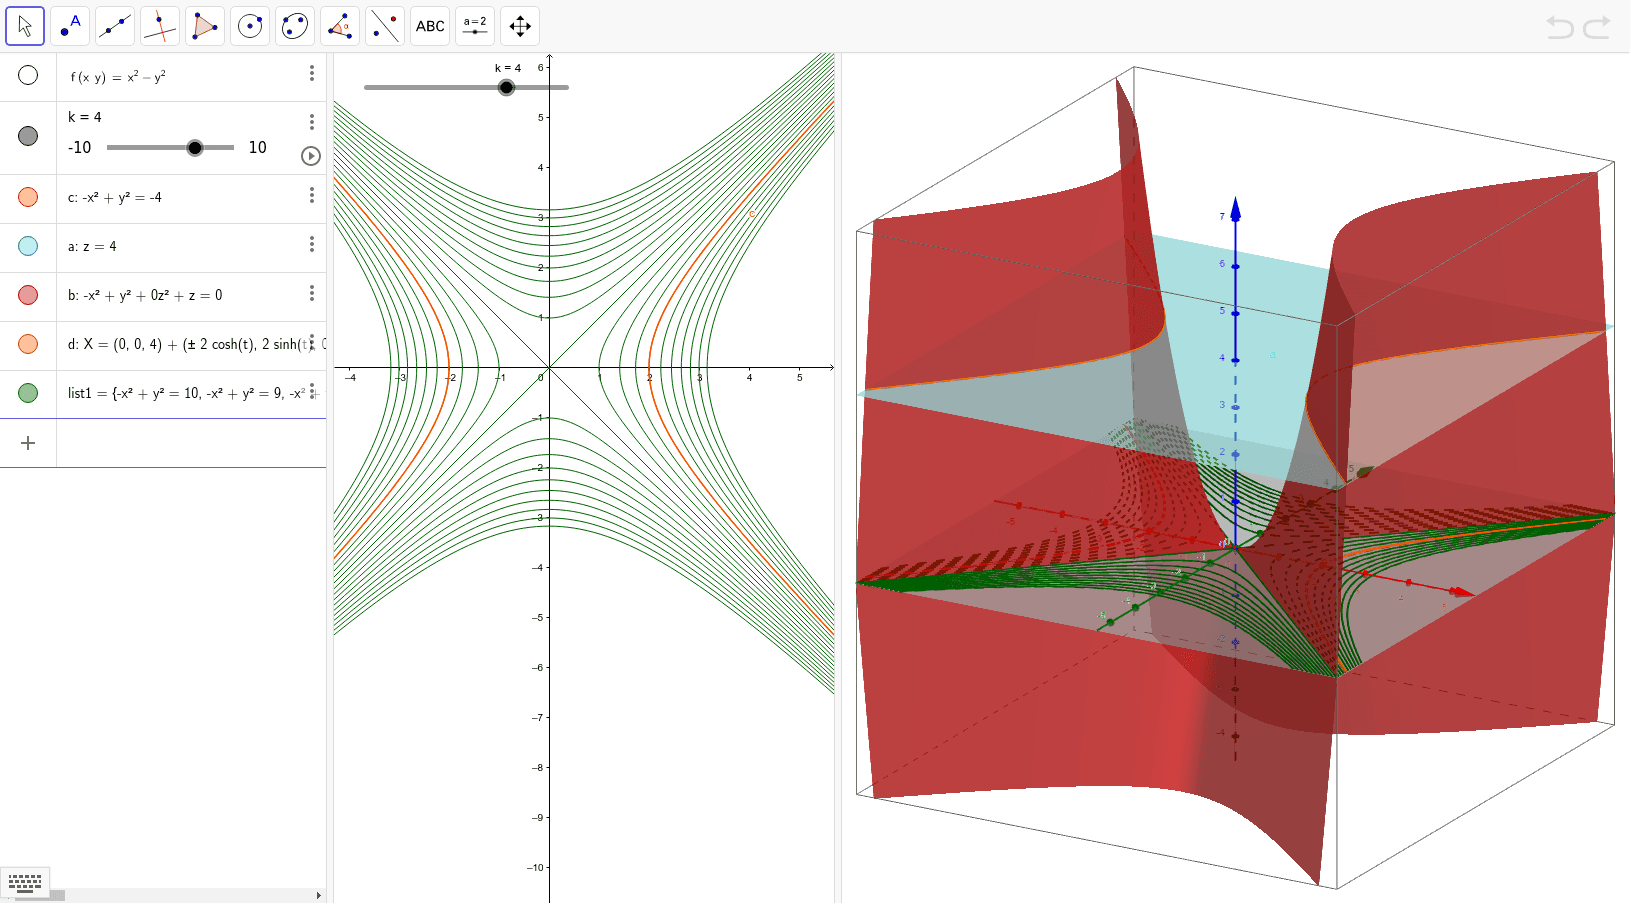
This example demonstrates how to create contour plots and 3D surfaces for functions. It involves core math concepts like functions, trigonometric functions, integrals, and solid geometry. Key GeoGebra commands used are IntersectPath and Sequence for constructing the plot. Suitable for high school and above students learning function graphs and spatial geometry.
GeoGebra Commands & Parameters
IntersectPath(a, b) → dSequence(m = f(x, y), m, -10, 10) → list1
AI Drawing Prompt Reference
Create a contour plot and 3D surface graph to illustrate core mathematical concepts such as functions, trigonometric functions, integrals, and solid geometry. First, generate intersection points between a curve and the function's graph, then create a sequence ranging from -10 to 10, calculating the function's value at each point, and use these values to construct the contour plot and 3D surface, visually demonstrating the function's characteristics.
The prompt above was compiled from the original drawing commands and is for reference only.