
Continuity of a Piecewise Defined Function
Loading the math board and drawing, please wait…
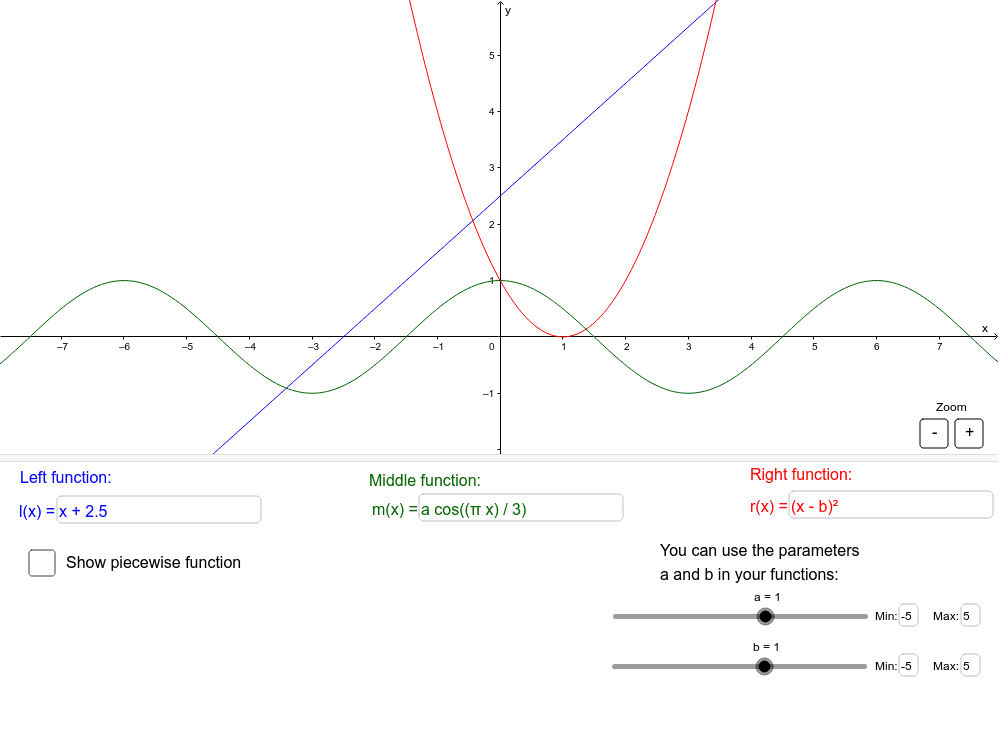
This GeoGebra example dynamically explores the continuity of a piecewise-defined function composed of three segments, visually demonstrating whether the graph connects or breaks at the partition points. The core mathematical concepts include the definition of continuity, left-hand and right-hand limits, domain and range of piecewise functions, and the use of inequalities to restrict each piece's interval. The construction employs Textfield for user input, If commands to select expressions based on conditions, Line and Segment objects for auxiliary lines or interval boundaries, and multiple objects such as c1, c2, and inequality lists to manage the piecewise intervals and function values. It is suitable for high school or introductory college calculus students to grasp the geometric meaning of continuity, and serves as an interactive tool for classroom demonstrations or self-paced exploration.
GeoGebra Commands & Parameters
Textfield(l) → inputLTextfield(m) → inputMTextfield(r) → inputRTextfield(c1) → inputc1aTextfield(c1) → inputc1bTextfield(c2) → inputc2aTextfield(c2) → inputc2bIf(choice ≟ 0, f0, If[choice ≟ 1, f1, If[choice ≟ 2, f2, f3]]) → fLine(c1LineP1, c1LineP2) → c1LineLine(c2LineP1, c2LineP2) → c2LineLine(draglineA, draglineB) → draglineSegment((x(P), 0), P) → PlineTextfield(amin) → inputaminTextfield(amax) → inputamaxTextfield(bmin) → inputbminTextfield(bmax) → inputbmaxTextfield(cmin) → inputcminTextfield(cmax) → inputcmax