
Continuity Exploration at x=a
Loading the math board and drawing, please wait…
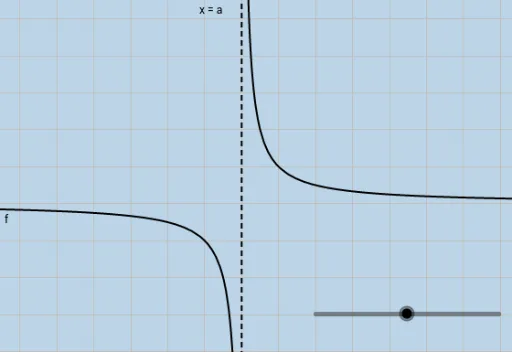
This example demonstrates how to visualize the continuity of a function f at x=a using GeoGebra. It covers core math concepts like function continuity, limits, and derivatives. The construction uses GeoGebra objects: a (independent variable point), f (function graph), and g (auxiliary function). Suitable for high school mathematics education to help students understand the criteria and geometric meaning of function continuity.
GeoGebra Commands & Parameters
Numeric a(0)f(x) = 1 / (x - a)x = a