
Consumers' Surplus
Loading the math board and drawing, please wait…
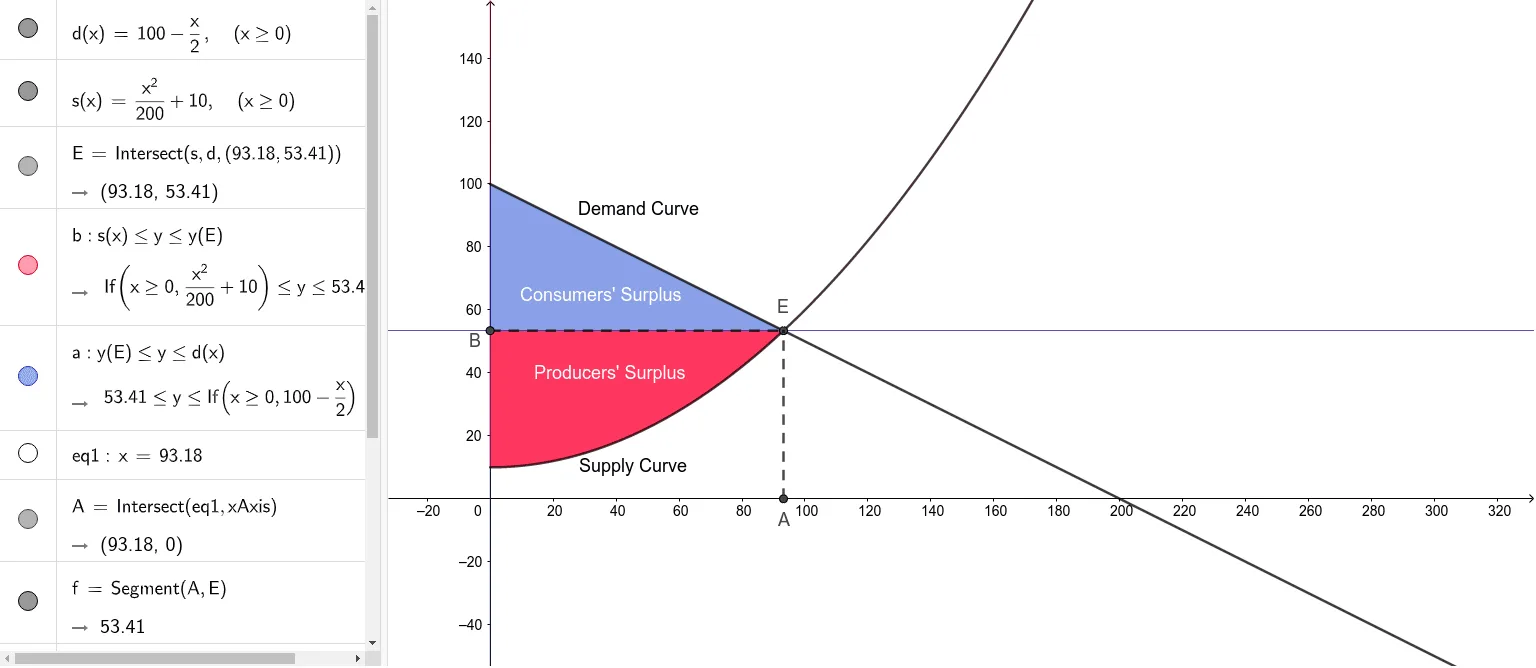
This example illustrates the concept of consumers' surplus using areas between curves. It involves core concepts of calculus and integration. Using commands like Intersect and Segment, demand and supply curves are constructed, and the consumers' surplus is calculated. Suitable for high school mathematics education and learning.
GeoGebra Commands & Parameters
Intersect(s, d, (93.17821063276354, 53.410894683618245)) → EIntersect(eq1, xAxis) → ASegment(A, E) → fIntersect(g, yAxis) → BSegment(B, E) → h
AI Drawing Prompt Reference
Draw a graph representing consumers' surplus. First, draw the demand curve and supply curve, which intersect at a point. Then, draw a line segment from the intersection point to a point on the demand curve, and another line segment from the intersection point to a point on the supply curve. Finally, calculate and label the area of consumers' surplus. Ensure the graph is clear, lines are accurate, and suitable for math education.
The prompt above was compiled from the original drawing commands and is for reference only.