
Constructing Graphs of Quadratic Functions (Parameterized Form)
Loading the math board and drawing, please wait…
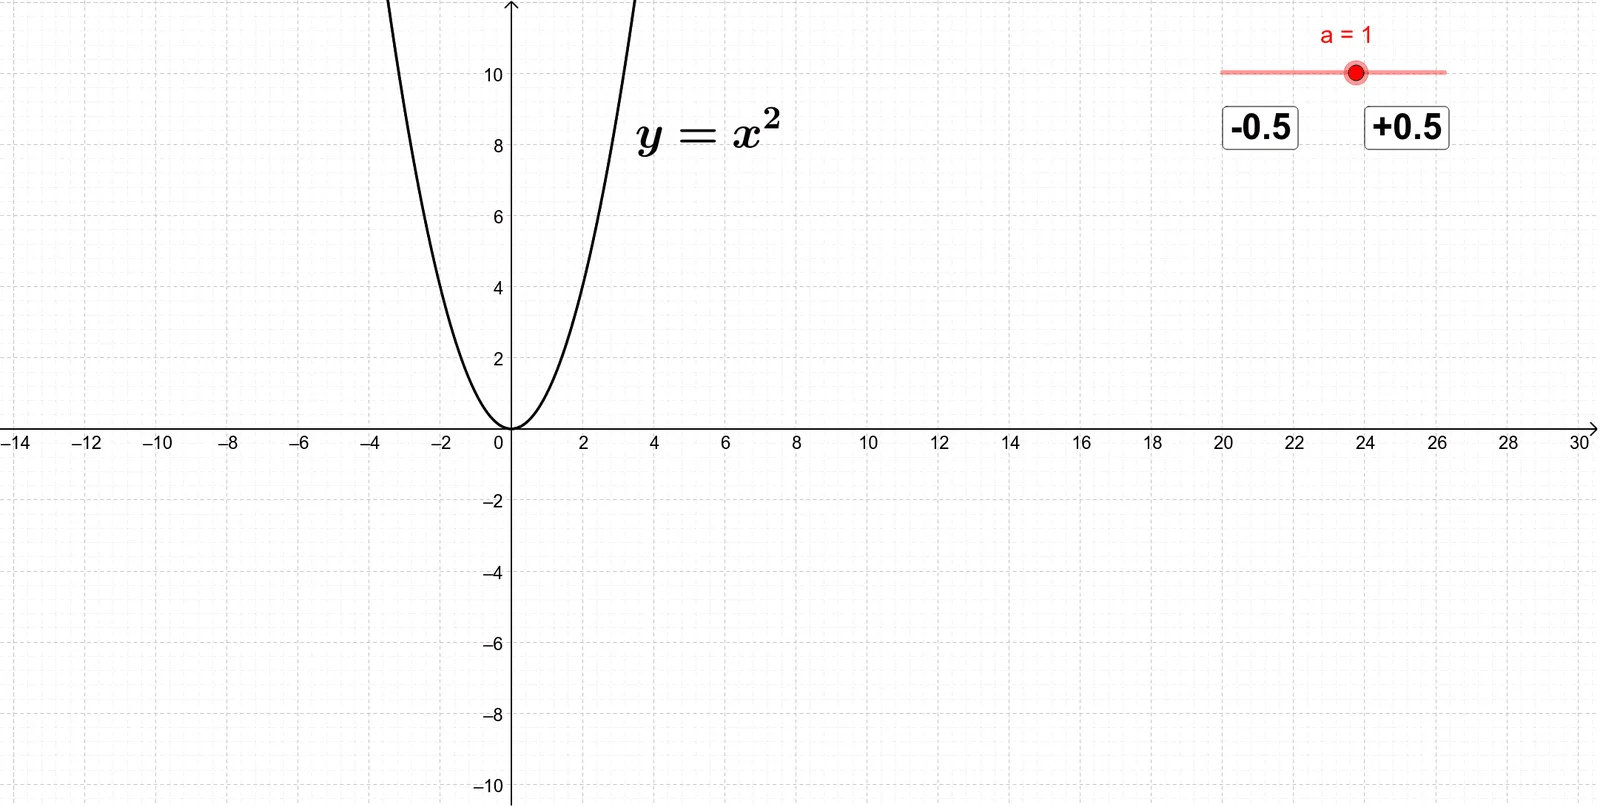
This example demonstrates how to construct and visualize a family of quadratic function graphs (parabolas) and how changing parameters affects the shape. The key mathematical ideas are quadratic functions, the characteristic features of a parabola (opening direction, vertex-related position, and symmetry governed by parameters), and graphing functions in a coordinate plane. From the construction summary, the model is built using GeoGebra primitives such as “Point” to create important points (e.g., h and B) that anchor the construction, and text objects (text1, text3) to label parameter meanings and key locations on the graph. Parameters a and d represent coefficient/offset-like quantities that control the resulting parabola. The presence of button1 and button2 suggests interactive controls for switching construction steps or updating parameter settings, enabling students to compare multiple quadratic graphs within a single dynamic scene. Suitable for middle and high school learners, classroom demonstrations, and self-guided exploration of function graphing and parameter effects.
GeoGebra Commands & Parameters
Point(d) → B
AI Drawing Prompt Reference
Draw a family of quadratic function graphs (parabolas) in a coordinate plane to show how parameter changes affect the shape, including opening direction, vertex position, and symmetry. A key point B is determined by parameter d, with text labels for parameter meanings and key locations. Include interactive buttons to control parameter settings and construction steps for comparing different quadratic function graphs.
The prompt above was compiled from the original drawing commands and is for reference only.