
Graphing Quadratic Functions in abc Form with Intersections
Loading the math board and drawing, please wait…
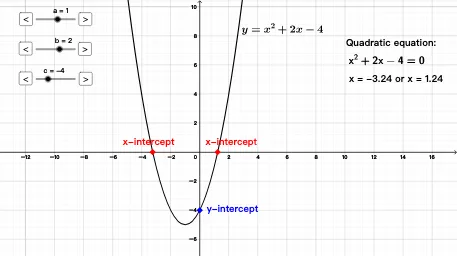
This example demonstrates how quadratic functions in abc form determine the shape and key features of a parabola, and how intersecting objects reveal important geometric points. It centers on core ideas such as the general quadratic function y=ax^2+bx+c (abc parameters controlling opening direction, vertex location, and intercepts), the relationship between intersection points and solving equations, and the role of symbolic simplification in producing interpretable results. Construction uses GeoGebra’s Intersect command to compute the intersection points between the quadratic graph and other related geometric objects, and Simplify to reduce algebraic expressions for clarity. The setup also uses multiple labeled parameters/points (a, b, c, d, A–G) and on-figure text objects (text1–text8, including text7 and text7_1) to connect algebraic parameters with displayed coordinates and annotations. Suitable for middle/high school math and classroom activities focused on function graphing, analytical geometry, and parameter-based exploration.
GeoGebra Commands & Parameters
Intersect(d, yAxis, 1) → ESimplify(text4) → text5Intersect(d, xAxis, 2) → FIntersect(d, xAxis, 1) → G
AI Drawing Prompt Reference
Draw a quadratic function y=ax^2+bx+c, where a, b, and c control the direction of opening, vertex location, and intercepts. Use the intersect command to find the points where the parabola meets the y-axis and x-axis, and simplify the expressions for clear results.
The prompt above was compiled from the original drawing commands and is for reference only.