
Construct a Function from Derivative Characteristics: Calculus Formative Assessm
Loading the math board and drawing, please wait…
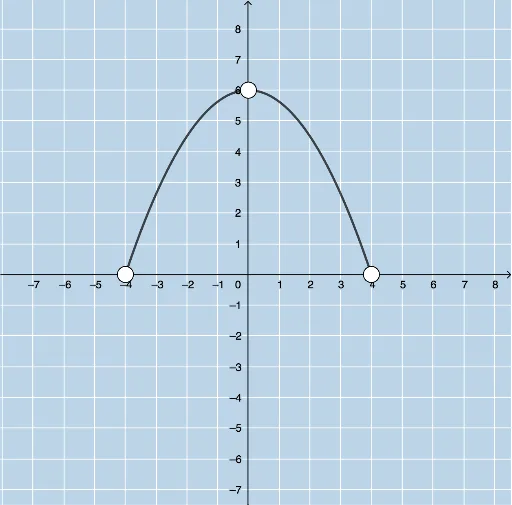
① This example demonstrates how to automatically generate a function whose graph satisfies user-specified characteristics of its first and second derivatives (e.g., increasing/decreasing intervals, concavity), serving as a formative assessment quiz question. ② Core mathematical concepts include derivatives, second derivatives, monotonicity, concavity, polynomial fitting, random generation, and normal distribution (for generating random features). ③ Construction highlights: uses GeoGebra commands such as FitPoly to fit polynomial functions, Min and Max to define intervals, Sequence, RandomElement, and Random to generate random characteristics, mean and FractionText for displaying fractions, CountIf, Sort, and Element for answer checking and feedback, plus a button (button1) to trigger new questions and multiple text objects (text1, etc.) to display prompts and feedback. ④ Suitable for high school or college calculus courses focusing on applications of derivatives; teachers can quickly generate varied practice problems, and students receive immediate feedback.
GeoGebra Commands & Parameters
Min({x(A), x(B), x(C)}) → aMax({x(A), x(B), x(C)}) → bFitPoly({A, B, C}, 2) → fSequence((2 * i), i, -5, 4, 1) → l1RandomElement(l1) → cRandom(-8, 8) → outputcSequence(i, i, c + 2, 10, 2) → l2RandomElement(l2) → dmean(c, d) → eSequence(i, i, -10, 10, 1) → numlistFractionText(m) → text1Random(1, 7) → nRandom(1, 5) → wRandom(1, 2) → pRandom(1, 2) → kSequence(c + ((e - c) * i / 50), i, 1, 49, 1) → leftlistSequence(e + ((d - e) * i / 50), i, 1, 49, 1) → rightlistSequence(g'(Element[leftlist, i]), i, 1, 49, 1) → LeftDsCountIf(x < 0, LeftDs) → DerivLeftNegSequence(g'(Element[rightlist, i]), i, 1, 49, 1) → RightDsCountIf(x < 0, RightDs) → DerivRightNegSort({x(A), x(B), x(C)}) → l3Element(l3, 2) → SecondTest
AI Drawing Prompt Reference
Draw a function graph where the derivative changes sign in specified intervals and the second derivative indicates concavity. Start by identifying three points and fitting a quadratic polynomial to generate the function. Randomly select two points, calculate their mean as the vertex, and create linear interpolations for the left and right segments. Compute the derivatives of these segments, count the number of negative values, and use this information to plot the function graph, labeling key points and derivative features.
The prompt above was compiled from the original drawing commands and is for reference only.