
Connectivity Table: Visualizing Tetrahedron Vertices and Edges
Loading the math board and drawing, please wait…
In collections
Solids, graphs and paths
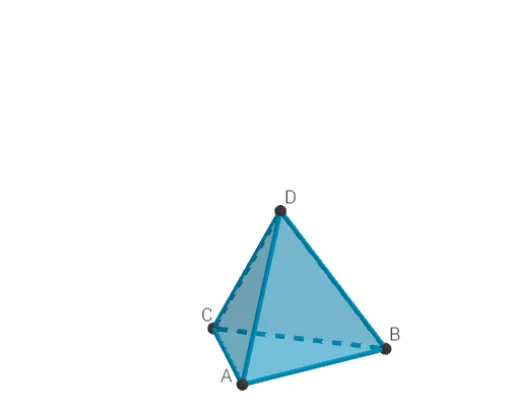
This GeoGebra example constructs a tetrahedron and uses the TableText command to generate a 'connectivity table' that clearly displays the edge connections among the vertices (A, B, C, D). The core mathematical concepts involve solid geometry, specifically the structure of polyhedra, vertex-edge adjacency, and the tabular representation of descriptive data. Construction highlights include using Circle and Intersect to create base circles and intersection points, Rotate and Point to position spatial points, Tetrahedron to generate the solid, and TableText to organize the edges (e.g., RibbeAB, RibbeAC, etc.) into a readable table. This example is suitable for upper secondary or introductory university students, helping them understand the topological structure of polyhedra in 3D geometry while also serving as an accessible introduction to combining geometric visualization with data tables.
GeoGebra Commands & Parameters
TableText({{"A", "B", "C", "D"}}) → tekst2TableText({{"A"}, {"B"}, {"C"}, {"D"}}) → tekst3Circle(O, 1, xOyPlane) → cIntersect(yAxis, c, 2) → ARotate(A, 90°) → BPoint(Circle[Midpoint[A, B], (Distance[A, B] * sqrt(3) / 2), Segment[A, B]]) → CTetrahedron(A, B, C) → a, D, RibbeCD, RibbeBD, zijvlakABC, zijvlakACD, zijvlakABD, zijvlakBCD, RibbeAC, RibbeAB, RibbeBC, RibbeAD