
Conic Sections in Polar Coordinates: Focus, Directrix, and Eccentricity
Loading the math board and drawing, please wait…
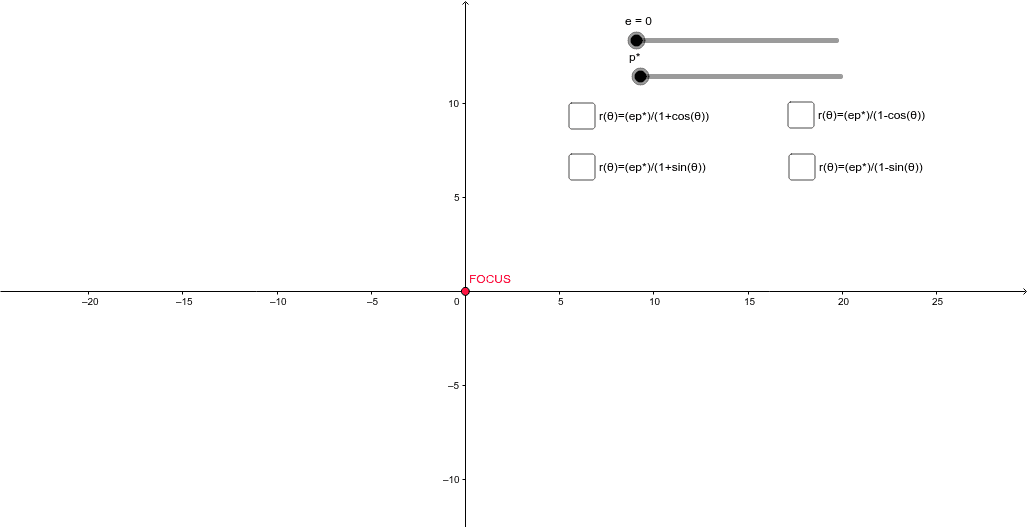
This GeoGebra example visualizes conic sections (ellipse, parabola, hyperbola) in polar coordinates using the unified equation r = ep/(1 ± e·cosθ) or r = ep/(1 ± e·sinθ). By adjusting the eccentricity e and focal parameter p via sliders, users can observe how the shape transitions among the three types of conics. The core mathematical concepts include polar equations, the focus-directrix definition of conics, eccentricity, and parametric curves. The construction uses the CurveCartesian command to plot the parametric curve, along with multiple objects (e, p, f, a, g, h, k, b, c, d, i, j, l, m, n, q, r, s) and a FOCUS object to mark the focus point. This interactive tool is suitable for high school or early college students studying analytic geometry, and for teachers demonstrating the unified polar representation of conic sections in classroom settings.
GeoGebra Commands & Parameters
CurveCartesian((cos(t) * f(t)), (f(t) * sin(t)), t, 0, 6.28319) → aCurveCartesian((cos(t) * g(t)), (g(t) * sin(t)), t, 0, 6.28319) → bCurveCartesian((cos(t) * h(t)), (h(t) * sin(t)), t, 0, 6.28319) → cCurveCartesian((cos(t) * k(t)), (k(t) * sin(t)), t, 0, 6.28319) → d
AI Drawing Prompt Reference
Create a polar-coordinate visualization of conic sections showing ellipse, parabola, and hyperbola. Use a unified polar equation with two sliders to adjust eccentricity and focal parameter, dynamically changing the curve shape. Mark the focus point clearly. Draw multiple curves for different parameter values, each spanning angles from 0 to 2π. The curves radiate around the pole, transitioning from closed ellipses to open parabolas and hyperbolic branches as eccentricity changes. The overall pattern is symmetric in polar coordinates, with the focus as a key reference point.
The prompt above was compiled from the original drawing commands and is for reference only.