
Conditional Probability & Frequency Distribution Demo
Loading the math board and drawing, please wait…
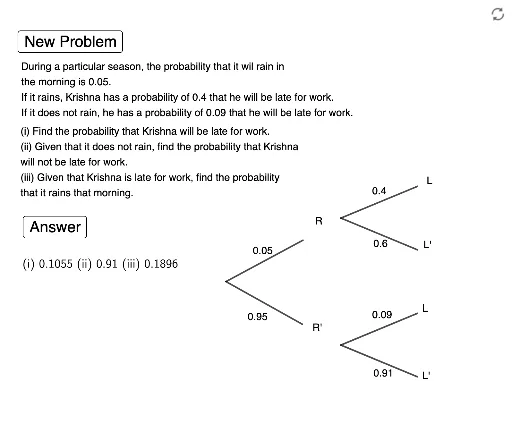
This example demonstrates the relationship between conditional probability and frequency distribution using interactive graphics, exemplified by a pyramid-shaped frequency distribution. It involves core math concepts like conditional probability, basic probability theory, correlation analysis, and random experiments. GeoGebra commands like If, Intersect, and Segment are used to construct the pyramid distribution, calculate intersections, and draw segments. Suitable for high school mathematics teaching, particularly for visualizing concepts in probability and statistics chapters.
GeoGebra Commands & Parameters
If(c ≟ 1 ∨ c ≟ 3, "is", "is not") → text4Intersect(xAxis, yAxis) → ASegment(A, B) → fSegment(A, C) → gSegment(D, E) → hSegment(D, F) → lSegment(G, H) → jSegment(G, I) → kIf(c ≟ 1, iii1, If[c ≟ 2, iii2, If[c ≟ 3, iii3, iii4]]) → iiiIf(c ≟ 1 ∨ c ≟ 3, i1, i2) → iIf(c ≟ 1 ∨ c ≟ 2, "rains", "does not rain") → text18If(c ≟ 1 ∨ c ≟ 3, "will be", "will not be") → text3
AI Drawing Prompt Reference
Draw a pyramid-shaped frequency distribution diagram to illustrate conditional probability and frequency distribution. Start with coordinate axes, then extend multiple segments from the origin to form the pyramid outline. Inside the pyramid, use colored regions or segments to represent frequency distributions under different conditions, with labels like "is" or "is not", "rains" or "does not rain". Switch between different distribution areas based on conditions, and display text indicating the current condition. The overall graphic should clearly show how changing conditions affect the shape of the frequency distribution.
The prompt above was compiled from the original drawing commands and is for reference only.