
Comprehensive Math Demo: Exponent, Parabola, Binomial & Normal Distributions, In
Loading the math board and drawing, please wait…
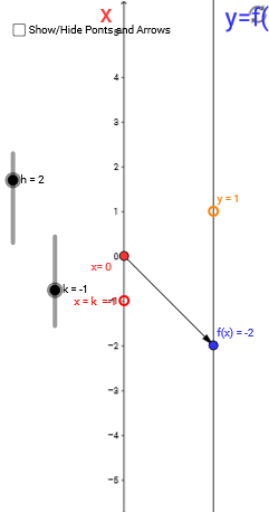
① This example is a comprehensive mathematical demonstration that simultaneously showcases exponential functions, parabolas, binomial distribution, normal distribution, and interest calculation. ② Core mathematical concepts include exponent, parabola, binomial distribution, normal distribution, and interest calculation, spanning algebra, geometry, probability & statistics, and financial mathematics. ③ Construction highlights: Based on the construction summary, it uses GeoGebra commands such as Point, Vector, Textfield, and Sequence, creating objects like points A, B, A_1, vector u, function f, texts text1 and text2, input box inputBox1, and numerous other objects (G1, H1, I1, J1, A1 through A18, B1 through B5, etc.) to build these graphs and interactive interfaces. ④ Target audience and use: Suitable for high school and above students, it can serve as a demonstration for comprehensive math exploration or interdisciplinary projects (e.g., math combined with finance), helping learners understand connections between different math branches and use GeoGebra's dynamic interaction to adjust parameters and observe changes.
GeoGebra Commands & Parameters
Point(yAxis) → A_1Vector(A_1, B) → uTextfield(f) → inputBox1Sequence(Vector[(0, i), (2, f(i))], i, k - 2, k + 2, 0.25) → list2Sequence((i, f(i)), i, k - 2, k + 2, 0.25) → list1
AI Drawing Prompt Reference
Create a comprehensive math demonstration showing an exponential curve, a parabola, binomial and normal distribution graphs, and interest calculation elements. On the coordinate plane, place a point on the y-axis and draw a vector from it. Add an input box to adjust function parameters. Along the function curve, generate a series of vertical vectors from the x-axis to the curve, and corresponding points on the curve, evenly spaced. The layout should clearly show connections between different math branches and allow interactive parameter adjustment to observe changes.
The prompt above was compiled from the original drawing commands and is for reference only.