
Compound Inequalities
Loading the math board and drawing, please wait…
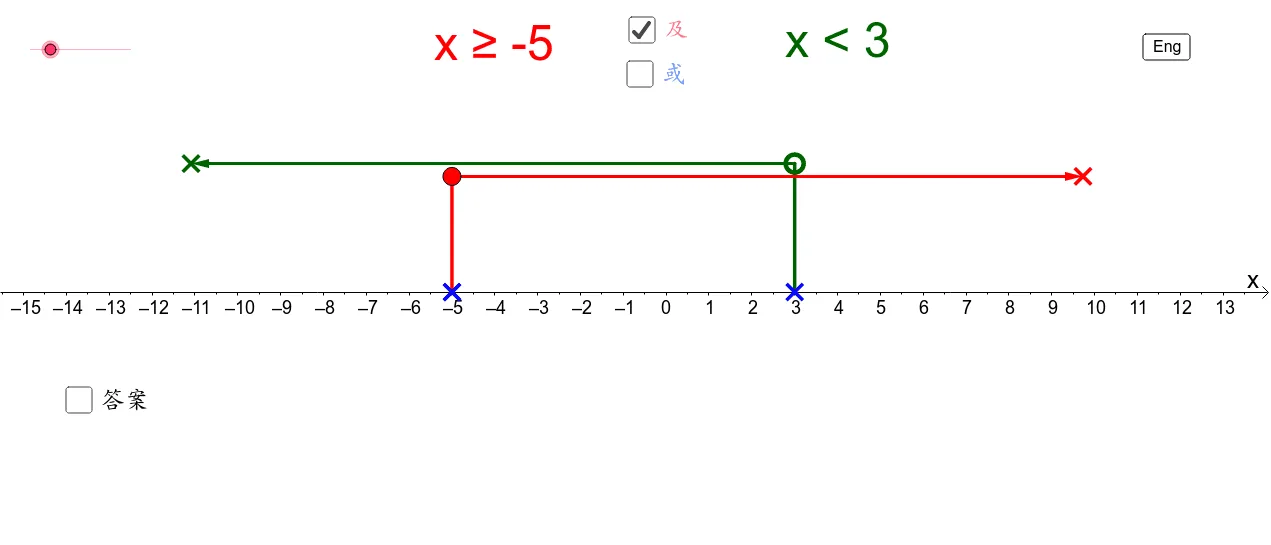
This example demonstrates the graphical representation of quadratic inequalities. Key mathematical concepts include inequalities and quadratic functions. Using GeoGebra commands such as Point, Segment, and Vector, the construction of the inequality graph is shown. Suitable for high school mathematics education.
GeoGebra Commands & Parameters
Point(xAxis) → APoint(xAxis) → BPoint(L2) → CPoint(L3) → DSegment(A, AI) → cSegment(B, BI) → dVector(AI, C) → uVector(BI, D) → vIf(BG > 0, If[Bequal, x ≥ x(B), x > x(B)], If[BG < 0, If[Bequal, x ≤ x(B), x < x(B)], x = x(B)]) → bIf(AG > 0, If[Aequal, x ≥ x(A), x > x(A)], If[AG < 0, If[Aequal, x ≤ x(A), x < x(A)], x = x(A)]) → aLaTeX($1) → text3
AI Drawing Prompt Reference
Graphically represent a quadratic inequality by showing the solution set in the coordinate system. Mark two key points on the x-axis, then draw line segments from these points to the parabolas. From the points on the parabolas, draw vectors towards the x-axis. Indicate the regions satisfying the inequality with different colors or line styles based on its truth value, and label the solution set appropriately in the diagram.
The prompt above was compiled from the original drawing commands and is for reference only.