
Complex Numbers and Probability Curve Demo
Loading the math board and drawing, please wait…
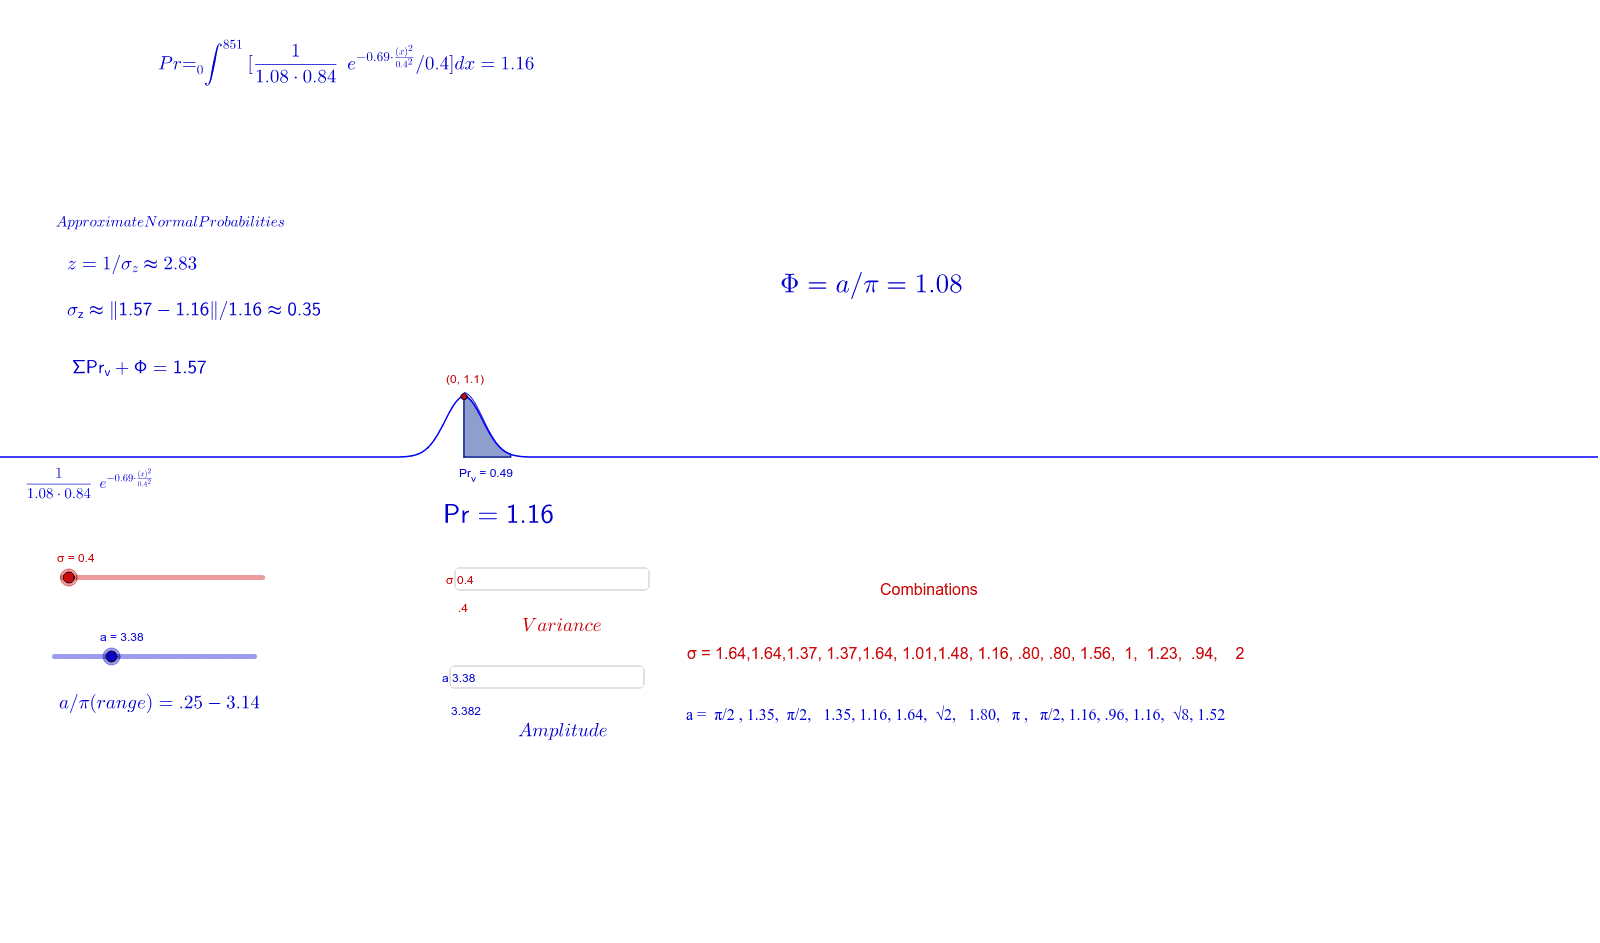
This example demonstrates how to incorporate Pi, i, a, and rv to create a probability curve. It involves core math concepts like complex numbers, probability & statistics, integrals, and function graphing. Constructed using GeoGebra commands such as Textfield, Integral, Point, allowing interactive value inputs. Suitable for high school and above mathematics education to visualize complex numbers in probability curves.
GeoGebra Commands & Parameters
Textfield(a) → InputBox1Integral(g, 0, 0.851) → areaPoint(g) → ATextfield(σ) → InputBox2Integral(h(x) / σ, 0, 0.851) → Pr_v
AI Drawing Prompt Reference
Create a mathematical illustration showing complex numbers and probability curves, featuring an input for variable a, an area representing the integral from 0 to 0.851, a point marking the position on function g, another input for variable σ, and a probability curve showing the integral of h(x)/σ from 0 to 0.851. Draw the function g and probability curve first, then highlight the integral area and mark the point, and finally add the inputs.
The prompt above was compiled from the original drawing commands and is for reference only.