
Complex Exponential Function
Loading the math board and drawing, please wait…
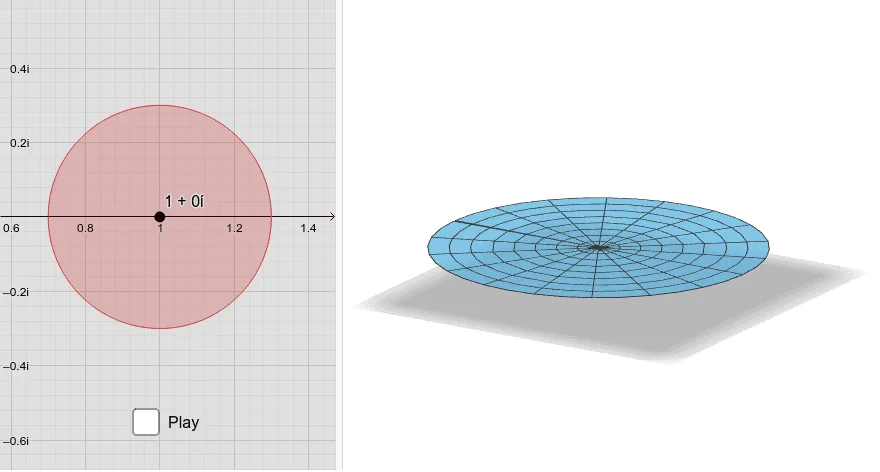
This example demonstrates the graph of a complex exponential function. It involves core mathematical concepts of complex numbers and exponential functions. Using GeoGebra commands such as Circle, PointIn, and Surface, the graph of the complex exponential function can be constructed. Suitable for high school students or math enthusiasts to learn about complex numbers and exponential functions.
GeoGebra Commands & Parameters
Circle((1, 0), r) → RegionPointIn(Region) → CSurface((u * cos(v)), (u * sin(v)), Re((u * cos(v)), (u * sin(v))), u, 0, 4, v, (-π), π - π / 200) → SurfReSurface((u * cos(v)), (u * sin(v)), Re2((u * cos(v)), (u * sin(v))), u, 0, 4, v, (-π), π - π / 200) → SurfRe2
AI Drawing Prompt Reference
Draw the graph of a complex exponential function, including a circle centered at the origin with radius 1, where any point on the circle represents a complex number. Construct a 3D surface using this complex number to show how the real part of the function changes with the complex number, with u values from 0 to 4 and v values from -π to π-π/200, displaying two different real part surfaces for visual effect.
The prompt above was compiled from the original drawing commands and is for reference only.