
Comparison of Poisson, Binomial, and Normal Distributions
Loading the math board and drawing, please wait…
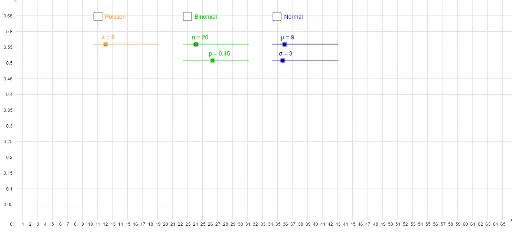
This interactive example provides a visual comparison between the Poisson, Binomial, and Normal distributions. It demonstrates the fundamental concepts of discrete and continuous probability distributions and illustrates how these distributions approximate one another under specific parameter conditions. The construction utilizes GeoGebra's specialized commands such as BinomialDist, Poisson, and Normal, with dynamic control provided by objects including $\lambda$, $n$, $p$, $\mu$, and $\sigma$. This tool is ideal for high school statistics students or undergraduate probability courses to visualize the convergence and differences between these key statistical models.
GeoGebra Commands & Parameters
BinomialDist(n, p) → aPoisson(λ) → bNormal(μ, σ, x, false) → f
AI Drawing Prompt Reference
Draw three probability distribution graphs: binomial, Poisson, and normal, with dynamic sliders to adjust parameters, showing their relationships and approximations. The binomial and Poisson distributions are controlled by parameters n, p, λ, while the normal distribution is controlled by μ, σ. All distributions are displayed in the same coordinate system to compare their shapes and convergence.
The prompt above was compiled from the original drawing commands and is for reference only.