
Comparison Distribution
Loading the math board and drawing, please wait…
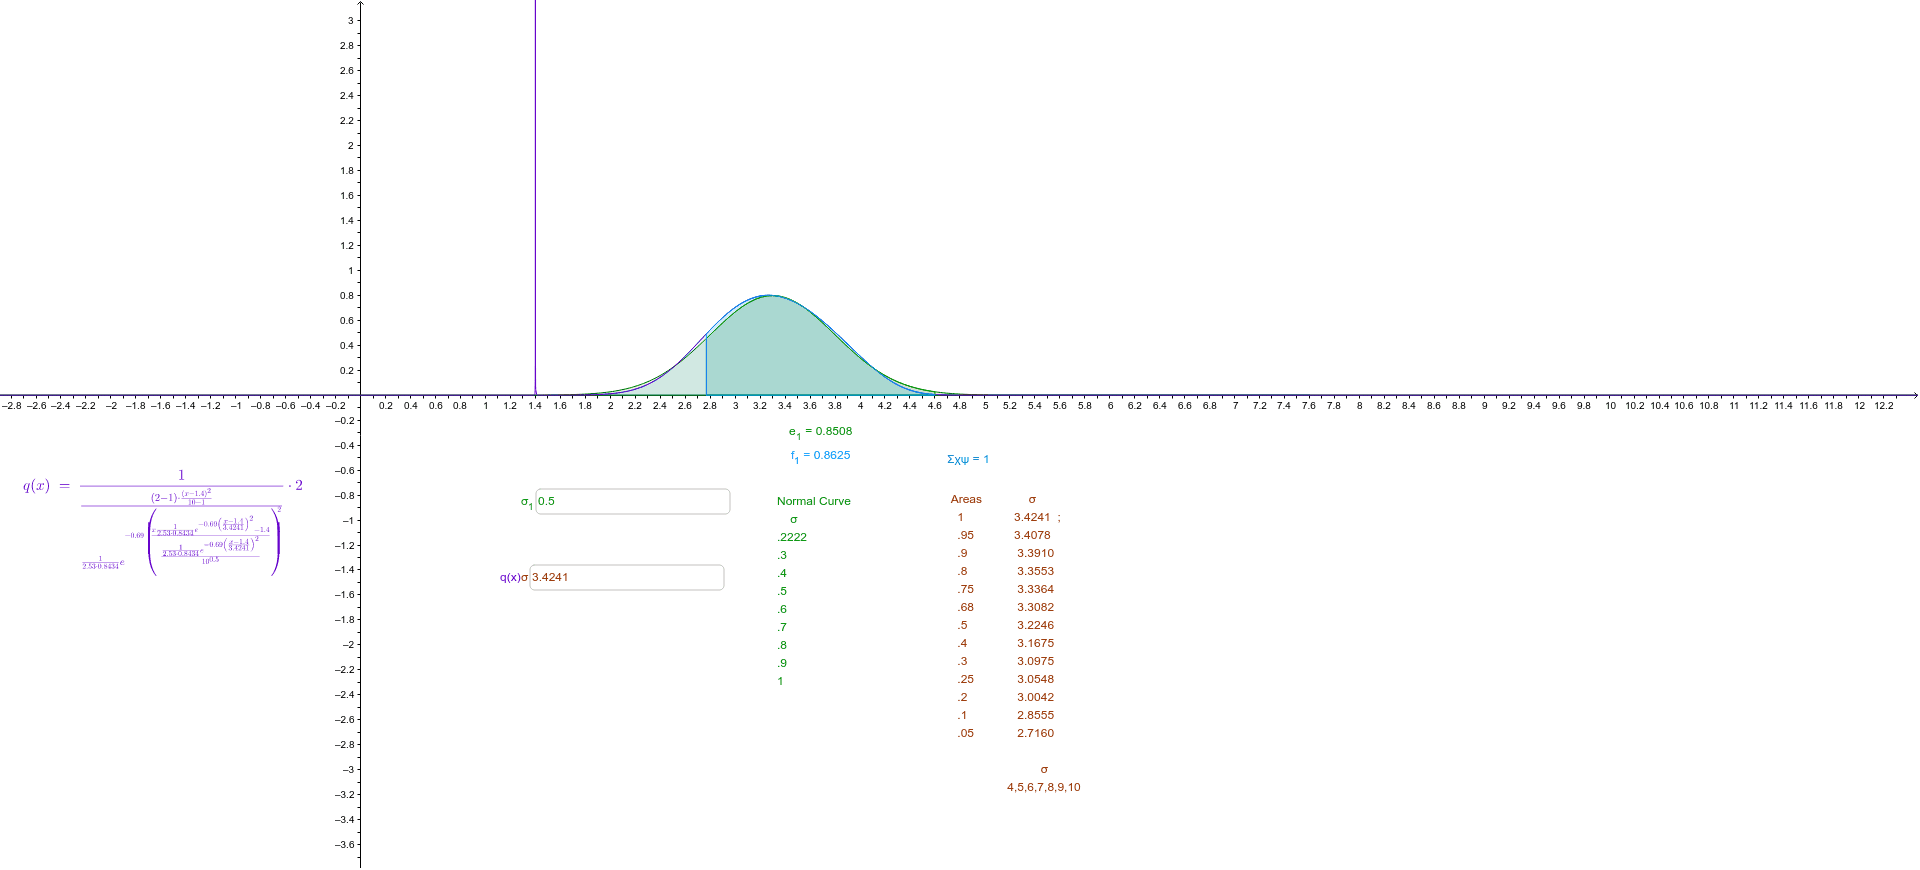
This example demonstrates a distribution that can be used for comparison to the Normal distribution. It involves core mathematical concepts such as Standard Deviation, Logarithmic Functions, Translation, Function Graph, Derivative, Centroid or Barycenter. The construction utilizes GeoGebra commands/objects like Integral, Textfield, Line, Angle, Point, Segment, and OrthogonalLine. Suitable for high school and above students to understand and compare different distribution characteristics.
GeoGebra Commands & Parameters
Integral(q, 1.8, 7.6) → ΣχψTextfield(σ_2) → ΔχψTextfield(μ) → inputBox2Line(E, F) → φTextfield(σ_1) → φ_1Integral(r, -Infinity, Infinity) → eIntegral(r, -500, 500) → δIntegral(r, 3.26, 4.26) → ΠξAngle(φ, ζ_1) → αPoint(q) → GSegment(H, I) → iPoint(k) → JTextfield(μ_1) → inputBox3Integral(r, 0, 1) → ΠIntegral(q, 1.9, 2.77) → oIntegral(r, 2.77, 3.26) → uTextfield(μ) → inputBox1OrthogonalLine(K, xAxis) → bPoint(b) → AIntegral(q, 1.9, 2.3845) → cIntegral(r, 2.3845, 2.77) → dIntegral(q, 1.9, 2.77) → vIntegral(r, 2.77, 4.6) → e_1Integral(q, 2.77, 4.6) → f_1
AI Drawing Prompt Reference
Draw a distribution graph for comparison with the normal distribution. Include two function curves, one as reference and one to compare. Place several adjustable text boxes on the axes for entering mean and standard deviation parameters. Connect corresponding points on the two curves with line segments and label the angle they make with the horizontal axis. Fill multiple integral regions under the curves with different colors to represent probability areas over various intervals. Add a vertical auxiliary line perpendicular to the horizontal axis and mark a point on it. The overall layout should clearly show distribution shapes, parameter controls, and comparison of integral regions.
The prompt above was compiled from the original drawing commands and is for reference only.