
Comparing Z and T-Distributions: Effect of Degrees of Freedom on Critical Values
Loading the math board and drawing, please wait…
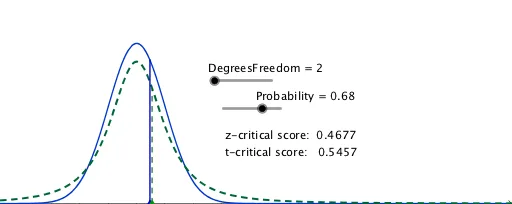
This GeoGebra example dynamically compares the standard normal (Z) distribution with the t-distribution, illustrating how the t-distribution has heavier tails and a lower peak, especially with small degrees of freedom. It demonstrates key statistical concepts such as probability density functions, degrees of freedom, critical values, confidence intervals, and the central limit theorem. The construction uses GeoGebra commands including Gamma, InverseNormal, and InverseTDistribution to generate the distribution curves and critical values, Segment to draw reference lines, and a slider (DegreesFreedom) to adjust the degrees of freedom, updating the displayed probability and text in real time. This resource is suitable for high school to undergraduate statistics courses, helping students understand when to use the t-distribution versus the normal distribution in hypothesis testing and confidence interval estimation.
GeoGebra Commands & Parameters
Gamma(0, 1, 0.1) → cGamma(0, 1, 0.5) → dGamma(1, 2, 0.5) → eInverseNormal(0, 1, Probability) → fInverseTDistribution(DegreesFreedom, Probability) → iSegment((f, 0), (f, g(f))) → jSegment((i, 0), (i, h(i))) → k