
Comparing Two Fractions: Visual Demonstration
Loading the math board and drawing, please wait…
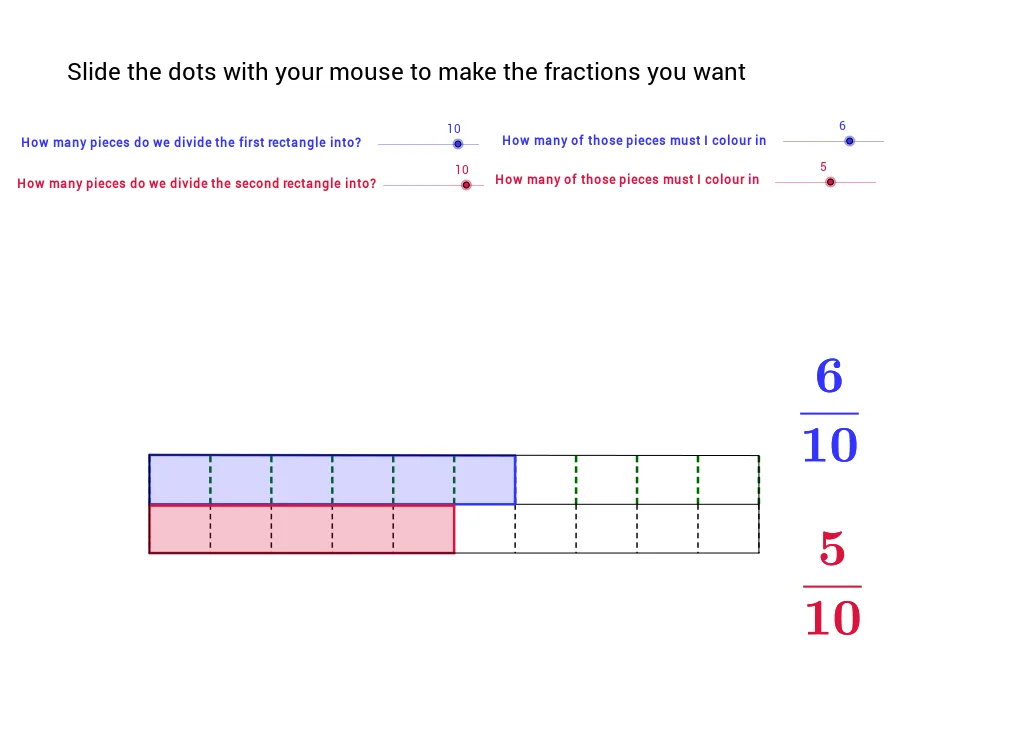
This GeoGebra example provides a dynamic visual demonstration for comparing the magnitude of two fractions. The core mathematical concepts covered include fraction comparison, least common multiple (LCM) for finding common denominators, inequality relationships, and the geometric meaning of fractions as lengths or areas. Construction highlights involve the GeoGebra commands LCM to compute the least common multiple of denominators, Sequence to generate lists, Element to extract list items, Segment to draw fraction segments, and Polygon to construct area models. Relevant objects include numerator and denominator variables num1, den1, num2, den2, multiple list objects list1 through list7, and polygon objects poly1 and Poly2. This resource is suitable for upper elementary and middle school mathematics instruction, supporting classroom teaching and independent student inquiry into fraction size and equivalence.
GeoGebra Commands & Parameters
LCM(den1, den2) → bSequence((-5 + i * 10 / den1, 0), i, 0, den1) → list1Element(list1, 1) → cSequence((-5 + i * 10 / den1, 0.8), i, 0, den1) → list2Sequence(Segment[Element[list1, i], Element[list2, i]], i, 1, den1 + 1) → list3Sequence((-5 + i * 10 / den2, 0), i, 0, den2) → list4Sequence((-5 + i * 10 / den2, -0.8), i, 0, den2) → list5Sequence((-5 + i * 10 / b, 0), i, 0, b) → list7Sequence(Segment[Element[list4, i], Element[list5, i]], i, 0, den2 + 1) → list6Segment(D, C) → aPolygon(E, F, J_1, K_1) → poly1, e, f, j_1, k_1Polygon(H, G, K_2, J_2) → Poly2, h, g, k_2, j_2Segment(J_1, K_11) → dSegment(J_1, K_2) → iSegment(K_2, K) → jSegment(K_11, K) → k
AI Drawing Prompt Reference
Create a geometric visual model for comparing the sizes of two fractions. Compute a common denominator from two given denominators, then build two aligned sets of vertical tick points along the same horizontal scale to represent the fraction subdivisions. Connect corresponding top and bottom tick points with short segment strips to form the partitioned bars for each fraction. Using the key endpoints from the first set, form one polygonal region to represent the first fraction area; using the key endpoints from the second set, form a second polygonal region in the same figure for comparison. Finally, draw a few connecting segments between the crucial boundary points of the two regions to make the length and area relationships based on the common denominator clear.
The prompt above was compiled from the original drawing commands and is for reference only.