
Compare Fractions Visual Demo
Loading the math board and drawing, please wait…
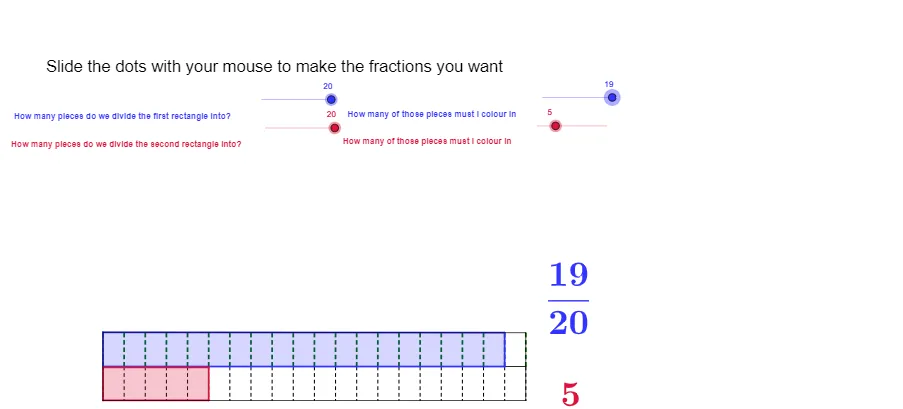
This example shows a visual comparison of two fractions using fraction bars. Core concepts include finding a common denominator via the least common multiple, inequality reasoning, and representing fractions graphically. Construction highlights: the LCM command computes the common denominator; Sequence creates lists of equal segments; Element extracts points; Segment and Polygon draw the bars and comparison regions, with objects such as den1, num1, den2, num2, list1‑list7, poly1, Poly2. Suitable for upper‑elementary to lower‑secondary fraction lessons and as an introductory GeoGebra geometric construction and list manipulation demo.
GeoGebra Commands & Parameters
LCM(den1, den2) → bSequence((-5 + (i * 10 / den1), 0), i, 0, den1) → list1Element(list1, 1) → cSequence((-5 + (i * 10 / den1), 0.8), i, 0, den1) → list2Sequence(Segment[Element[list1, i], Element[list2, i]], i, 1, den1 + 1) → list3Sequence((-5 + (i * 10 / den2), 0), i, 0, den2) → list4Sequence((-5 + (i * 10 / den2), -0.8), i, 0, den2) → list5Sequence((-5 + (i * 10 / b), 0), i, 0, b) → list7Sequence(Segment[Element[list4, i], Element[list5, i]], i, 0, den2 + 1) → list6Segment(D, C) → aPolygon(E, F, J_1, K_1) → poly1, e, f, j_1, k_1Polygon(H, G, K_2, J_2) → Poly2, h, g, k_2, j_2Segment(J_1, K_11) → dSegment(J_1, K_2) → iSegment(K_2, K) → jSegment(K_11, K) → k
AI Drawing Prompt Reference
Draw a visual comparison of two fractions using fraction bars. The bars are made of equal segments, with the number of segments matching the denominators. A shaded area between the bars shows the comparison result. Ensure the drawing is clear, with uniform lines and consistent proportions.
The prompt above was compiled from the original drawing commands and is for reference only.