
Comparing Fractions via LCM and Visual Models
Loading the math board and drawing, please wait…
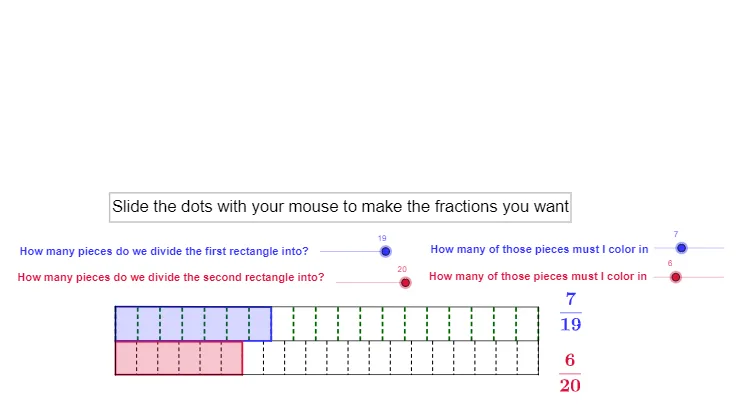
This example demonstrates how to compare two fractions by first converting them to a common denominator using LCM, then visually validating the comparison with constructed geometric representations. Key concepts include equivalent fractions, least common multiple (LCM) to unify denominators, comparing numerators after scaling, and structuring intermediate values with sequences and lists. Construction is driven by GeoGebra commands and objects from the build: LCM and Sequence generate the needed scaling factors; Element extracts the specific values from list structures (e.g., list1–list7) such as den1/num1 and den2/num2 components; Segment and Polygon create measurable geometric parts, and Polygon objects (poly1, Poly2) assemble the visual comparison model. The activity is intended for classroom use or self-study for middle and high school learners studying fractions and algebra, especially when teachers want a concrete visualization to support the “common denominator + numerator comparison” method.
GeoGebra Commands & Parameters
LCM(den1, den2) → bSequence((-5 + (i * 10 / den1), 0), i, 0, den1) → list1Element(list1, 1) → cSequence((-5 + (i * 10 / den1), 0.8), i, 0, den1) → list2Sequence(Segment[Element[list1, i], Element[list2, i]], i, 1, den1 + 1) → list3Sequence((-5 + (i * 10 / den2), 0), i, 0, den2) → list4Sequence((-5 + (i * 10 / den2), -0.8), i, 0, den2) → list5Sequence((-5 + (i * 10 / b), 0), i, 0, b) → list7Sequence(Segment[Element[list4, i], Element[list5, i]], i, 0, den2 + 1) → list6Segment(D, C) → aPolygon(E, F, J_1, K_1) → poly1, e, f, j_1, k_1Polygon(H, G, K_2, J_2) → Poly2, h, g, k_2, j_2Segment(J_1, K_11) → dSegment(J_1, K_2) → iSegment(K_2, K) → jSegment(K_11, K) → k
AI Drawing Prompt Reference
Draw a comparison diagram of two fractions by first finding their least common multiple and then converting them to have the same denominator. Use segments to represent the value parts of each fraction and polygons to visualize the comparison. The process involves calculating the least common multiple, generating a series of segments to represent each fraction's value part, and then using these segments to build polygons for the comparison visualization.
The prompt above was compiled from the original drawing commands and is for reference only.