
Comparing Quadratics: Vertex and Intersection Exploration
Loading the math board and drawing, please wait…
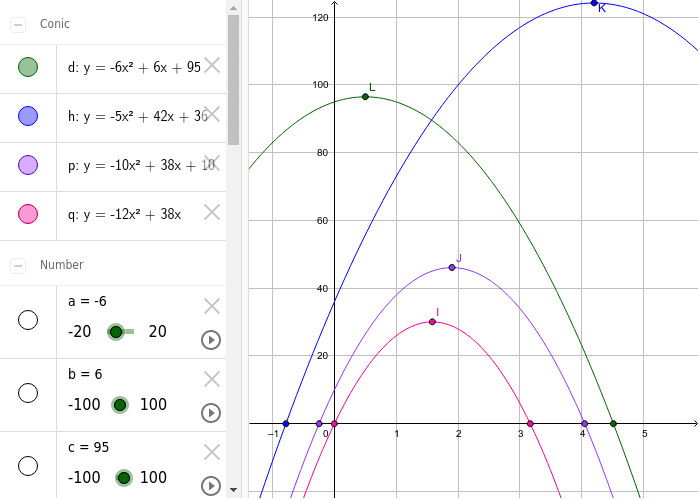
This GeoGebra example dynamically compares multiple quadratic functions, illustrating how the parabola's shape, vertex position, and intersections with axes change as coefficients vary. Core mathematical concepts include the standard form of a quadratic, vertex coordinates, discriminant and root relationships, and transformations of graphs. Construction highlights: using the Intersect command to find x-intercepts, the Vertex command to mark vertices, and multiple parameter objects (a, b, c, etc.) to control coefficients, allowing real-time adjustment via sliders or input fields. Suitable for middle and high school students learning quadratic properties, graph transformations, and equation solving, as well as for teacher demonstrations or student-led inquiry.
GeoGebra Commands & Parameters
Intersect(q, xAxis) → A, BIntersect(p, xAxis) → C, DIntersect(h, xAxis) → E, FIntersect(d, xAxis) → G, HVertex(q) → I, , ,Vertex(p) → J, , ,Vertex(h) → K, , ,Vertex(d) → L, , ,
AI Drawing Prompt Reference
Draw a coordinate plane with four parabolas in different colors. Each parabola crosses the x-axis, and its intersection points with the x-axis are marked with solid dots. The vertex of each parabola is marked with an open dot at the highest or lowest point on its axis of symmetry. The four parabolas have different shapes, some opening upward and some downward, with varying vertex positions and numbers of x-intercepts, to show how changing coefficients affects the graph. The layout is clear for easy comparison.
The prompt above was compiled from the original drawing commands and is for reference only.