
Comparing Positive and Negative Numbers with Geometry-Based Visuals
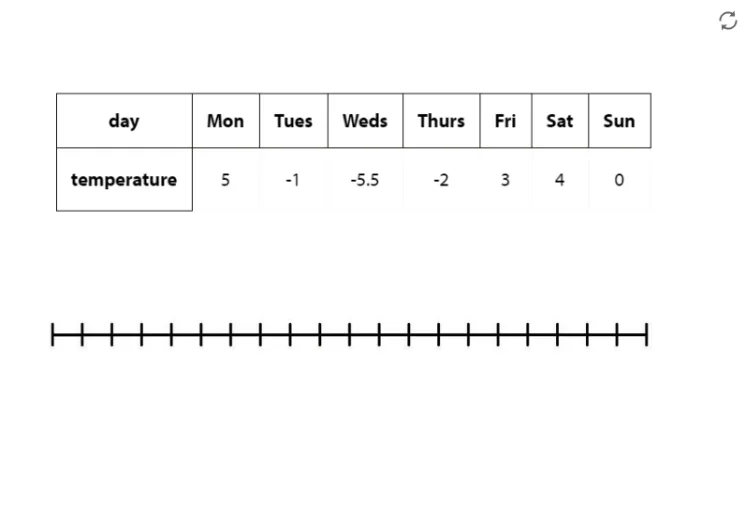
Loading the math board and drawing, please wait…
This example demonstrates how to compare positive and negative numbers using a geometry-based visualization. It makes clear which numbers are larger (e.g., any positive is greater than any negative, and among same-signed numbers the comparison depends on absolute value) by translating numerical values into positions within a diagram. The key mathematical ideas include sign and magnitude, ordering of integers/rational numbers, and reading relationships from number-line/coordinate-style representations that resemble function-graph interpretation. Construction is organized around multiple GeoGebra objects (A, B, C, D, E, F, G, H) together with auxiliary pictures (pic1, pic2), forming a set of comparable visual elements whose relative locations encode the numerical ordering. The activity is well-suited for middle school learners and as a classroom demonstration to strengthen conceptual understanding of inequalities and number comparison through visualization.
GeoGebra Commands & Parameters
Point A(-12, 1)Point B(-12, 5)Point C(-6, 5)Point D(-6, 1)Point E(-13, 3)Point F(4, 3)Point G(-13, -1)Point H(4, -1)
AI Drawing Prompt Reference
Draw a coordinate-plane visualization for comparing positive and negative numbers using point positions. Place a left vertical segment with endpoints at (-12, 1) and (-12, 5), and a matching vertical segment on the right with endpoints at (-6, 5) and (-6, 1), forming the side boundaries of a rectangle-like frame. Then add two horizontal reference lines using endpoints (-13, 3) to (4, 3) and (-13, -1) to (4, -1). Keep the given relative locations of all points so the diagram encodes number ordering through geometry.
The prompt above was compiled from the original drawing commands and is for reference only.