
Comparing Left, Right, and Midpoint Riemann Sums
Loading the math board and drawing, please wait…
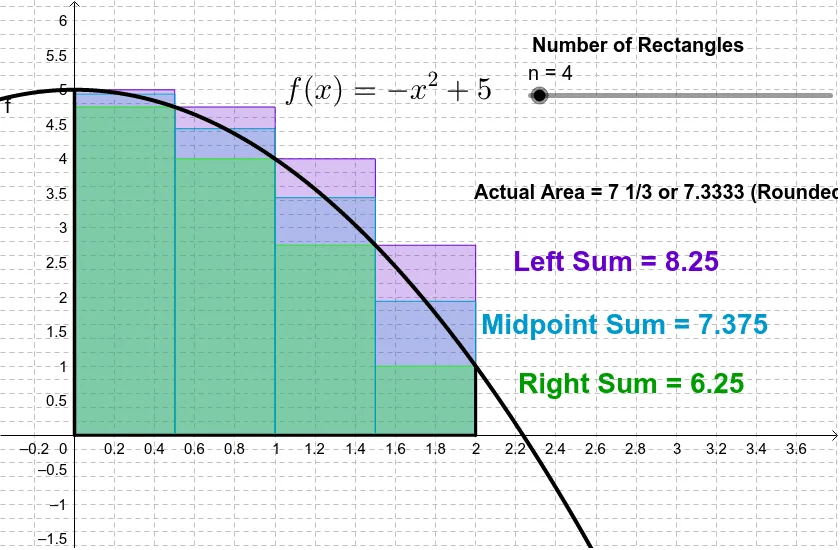
This example demonstrates how different types of Riemann sums approximate the area under a curve. Key mathematical concepts include Riemann sums, integrals, and functions. Using GeoGebra commands such as LowerSum, UpperSum, and LeftSum, various Riemann sum graphics are constructed. Suitable for high school mathematics education and learning integral concepts.
GeoGebra Commands & Parameters
LowerSum(f, a, b, n) → LowerSumUpperSum(f, a, b, n) → UpperSumLeftSum(f, a, b, n) → LeftSumRectangleSum(f, a, b, n, 1) → RightSumRectangleSum(f, a, b, n, r) → RectSumIntersect(f, yAxis, 1) → ASegment(A, B) → cPoint(f) → CPoint(xAxis) → DSegment(C, D) → dPoint(c) → EPoint(d) → FSegment(E, F) → eRectangleSum(f, a, b, n, 0.5) → MidpSumIntegral(f, 0, 2) → Area
AI Drawing Prompt Reference
Draw the left, right, and midpoint Riemann sums for the function f in the interval [0,2], approximating the area under the curve with different numbers of rectangles. Start by plotting the function, then draw the rectangles for left, right, and midpoint Riemann sums, and finally calculate and display the integral value of the interval.
The prompt above was compiled from the original drawing commands and is for reference only.