
Comparing and Contrasting Various Functions
Loading the math board and drawing, please wait…
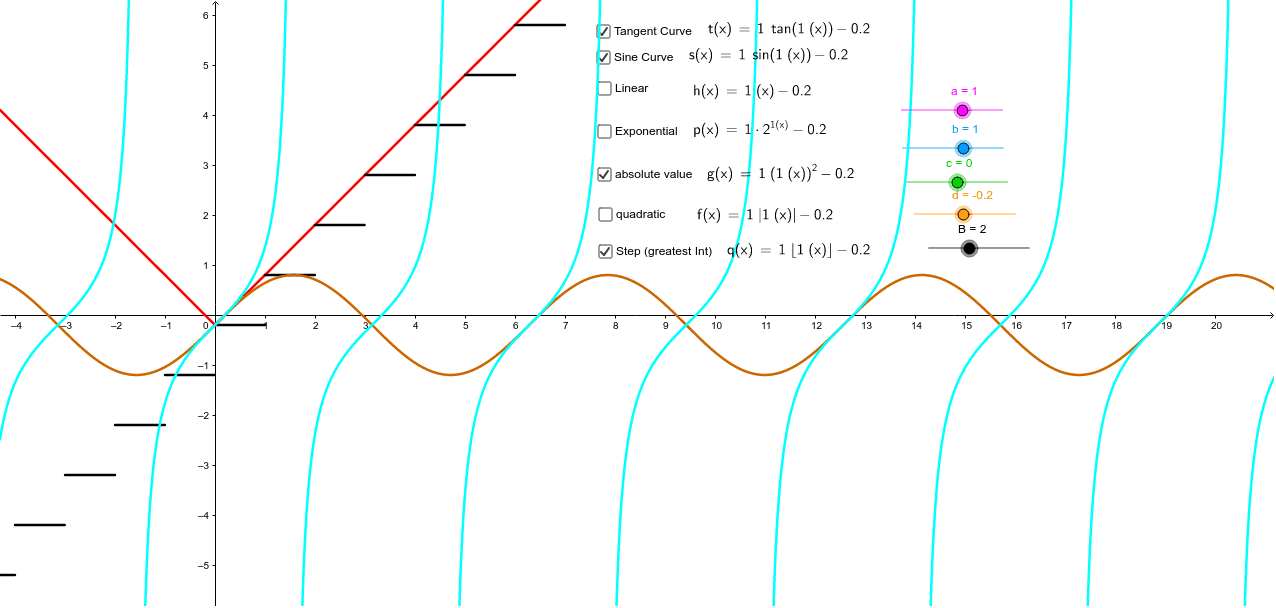
This example demonstrates how students can compare and contrast different mathematical models to find similarities and differences between transformations. It involves core math concepts like trigonometric functions, linear regression, exponential functions, and piecewise functions. Constructed using GeoGebra commands like LaTeX and objects such as B, d, c, b, a, g, text2, f, text3, h, text1, i, j, k, l, p, text4, e, q, text5, s, m, text6, t, n, text7. Suitable for high school mathematics teaching, focusing on function transformations and data analysis.
GeoGebra Commands & Parameters
LaTeX(g, true, true) → text2LaTeX(f, true, true) → text3LaTeX(h, true, true) → text1LaTeX(p, true, true) → text4LaTeX(q, true, true) → text5LaTeX(s, true, true) → text6LaTeX(t, true, true) → text7
AI Drawing Prompt Reference
Create a coordinate plane showing multiple function graphs for comparison, including trigonometric, linear regression, exponential, and piecewise functions. Use distinct colors or line styles for each curve, and place a mathematical formula label near each curve to indicate its expression. The graph should clearly display the trends of each function and highlight similarities and differences in their transformations, suitable for high school teaching on function transformations and data analysis.
The prompt above was compiled from the original drawing commands and is for reference only.