
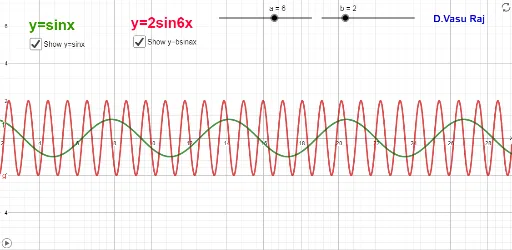
Compare y=bsinax with y=sinx
Loading the math board and drawing, please wait…
In collections
TRANSFORMATION OF FUNCTIONS
This example demonstrates the graphical transformation of the sine function y=bsinax compared to the standard sine function y=sinx, focusing on the effects of parameters b (amplitude) and a (period). Key mathematical concepts include sine function properties, amplitude and period transformations, and graphical shifts. The construction utilizes GeoGebra objects such as sliders a, b, g, f, text1, c, d, text2, text3 to dynamically visualize changes. Suitable for high school students studying trigonometric function transformations, providing an intuitive understanding of parameter effects on function graphs.
GeoGebra Commands & Parameters
Numeric a(6)Numeric b(2)g(x) = (b * sin((a * x)))f(x) = sin(x)Boolean c(true)Boolean d(true)