
Collect Organise & Summarise Data Exercise
Loading the math board and drawing, please wait…
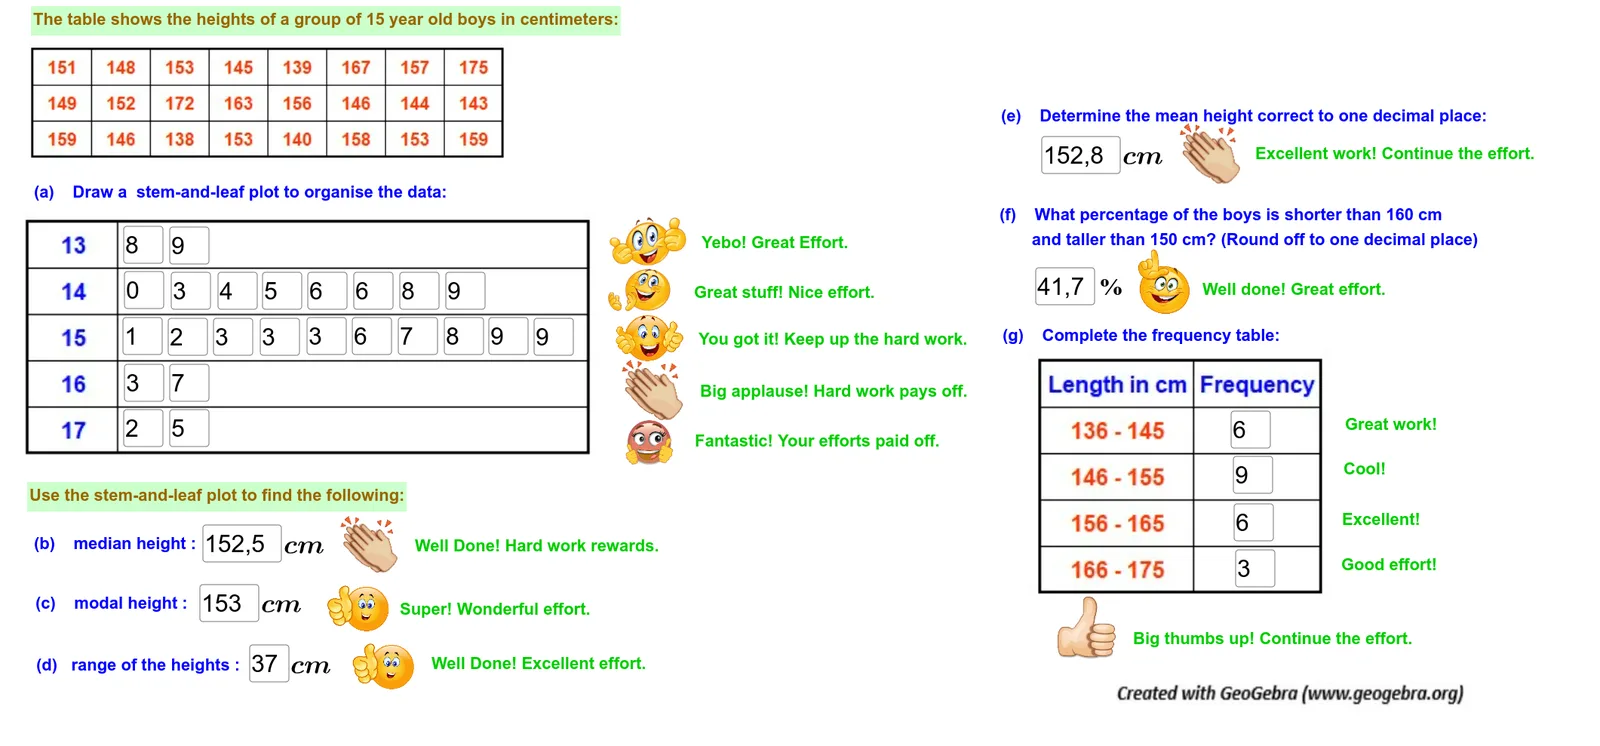
This example demonstrates how to collect, organize, and summarize data using GeoGebra, involving statistics and geometric constructions. Key math concepts include statistical data processing, expected value calculation, cuboid construction, circumcircle construction, and fractal geometry. The construction highlights the use of GeoGebra commands/objects like Textfield, buttons (knop1, knop2), input boxes (InputBox), and text objects (text1-text39). Suitable for high school mathematics education, focusing on data statistics and geometric construction practice.
GeoGebra Commands & Parameters
Textfield(text10) → InputBox2Textfield(text31) → InputBox8Textfield(text19) → InputBox5Textfield(text46) → InputBox9Textfield(text17) → InputBox4Textfield(text41) → InputBox6Textfield(text16) → InputBox7Textfield(text75) → InputBox13Textfield(text81) → InputBox18Textfield(text85) → InputBox20Textfield(text18) → InputBox1Textfield(text51) → InputBox3Textfield(text5) → InputBox10Textfield(text8) → InputBox11Textfield(text53) → InputBox12Textfield(text56) → InputBox14Textfield(text4) → InputBox15Textfield(text58) → InputBox16Textfield(text62) → InputBox17Textfield(text66) → InputBox19Textfield(text67) → InputBox21Textfield(text69) → InputBox22Textfield(text72) → InputBox23Textfield(text74) → InputBox24Textfield(text78) → InputBox25Textfield(text82) → InputBox26Textfield(text83) → InputBox27Textfield(text88) → InputBox28Textfield(text91) → InputBox29Textfield(text93) → InputBox30Textfield(text94) → InputBox31Textfield(text95) → InputBox32Textfield(text96) → InputBox33
AI Drawing Prompt Reference
Create a statistical and geometric construction example with multiple text fields, input boxes, and buttons to collect, organize, and summarize data. Demonstrate statistical data processing and expected value calculation, integrating cube, circumcircle, and fractal geometry constructions for data visualization. Text fields and input boxes are interconnected, with buttons controlling interactions, showcasing the integration of data statistics and geometric practice.
The prompt above was compiled from the original drawing commands and is for reference only.