
Cobweb Diagrams Demo
Loading the math board and drawing, please wait…
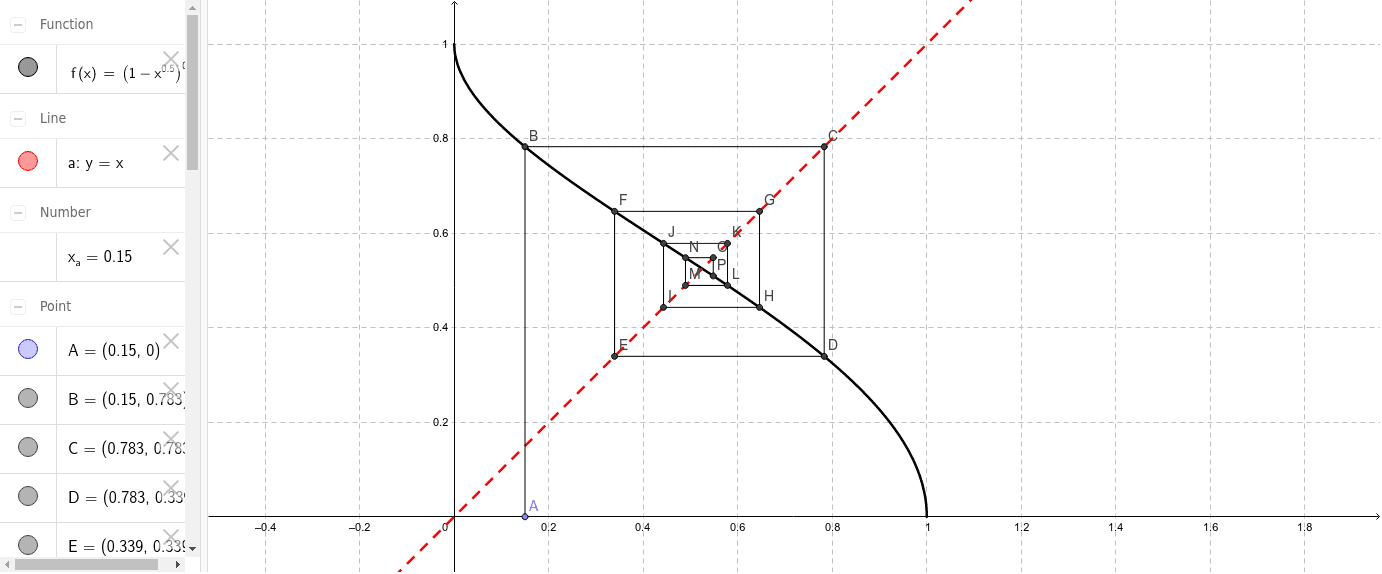
This example demonstrates convergence, divergence, and oscillation in iterative equations using cobweb diagrams. Key math concepts include function iteration, dynamical systems, and stability analysis. It is constructed using GeoGebra commands like Point and Segment, and objects such as functions a and f, points A, x_a, B, etc. Ideal for high school and above students studying dynamic systems and iterative functions.
GeoGebra Commands & Parameters
Point(xAxis) → ASegment(A, B) → bSegment(B, C) → cSegment(C, D) → dSegment(D, E) → eSegment(E, F) → gSegment(F, G) → hSegment(G, H) → iSegment(H, I) → jSegment(I, J) → kSegment(J, K) → lSegment(K, L) → mSegment(L, M) → nSegment(M, N) → pSegment(N, O) → qSegment(O, P) → r
AI Drawing Prompt Reference
Draw a cobweb diagram showing function iteration, dynamical systems, and stability analysis, featuring a point on the x-axis and multiple connected line segments forming a zigzag pattern that illustrates convergence, divergence, and oscillation in iterative processes.
The prompt above was compiled from the original drawing commands and is for reference only.