
Circumference and Diameter Relationship
Loading the math board and drawing, please wait…
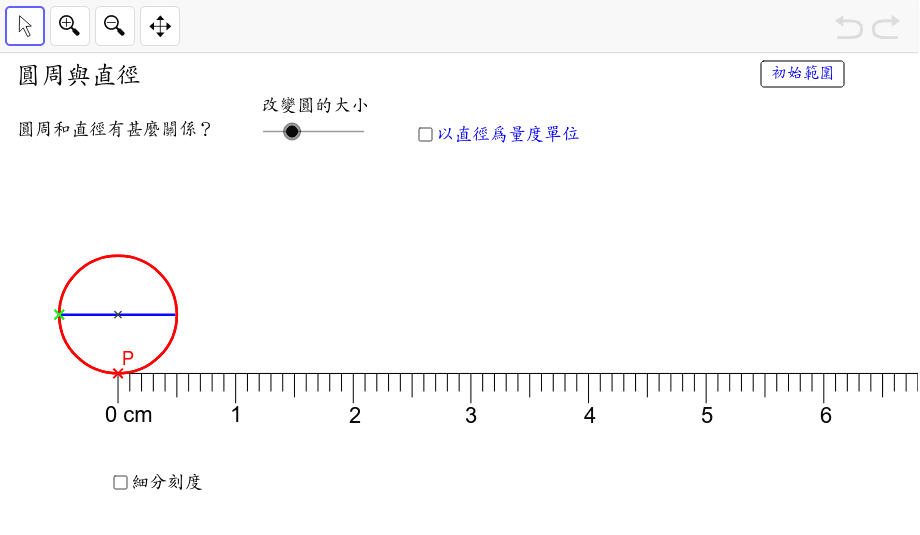
This example demonstrates the proportional relationship between the circumference and diameter of circles by measuring the circumferences of circles of different sizes. Key math concepts include pi (π) and ratios. Construction highlights involve commands like Point, Circle, Segment, CurveCartesian to draw circles and measure diameters and circumferences; using Slider to dynamically adjust circle sizes and observe data changes; displaying calculations and ratio relationships via text objects. Suitable for middle school and above students to understand basic circle properties and the meaning of pi, or for exploring function graphs and data analysis.
GeoGebra Commands & Parameters
Point(yAxis) → BCurveCartesian((r * (t - sin(t))), (r * (1 - cos(t))) + y(B), t, 0, 6.28319) → fPoint(f) → PIf(x(P) < (r * 3.141592653589793), acos(1 - (y(P) - y(B)) / r), (2 * 3.141592653589793) - acos(1 - (y(P) - y(B)) / r)) → θPoint(Segment[(x(D0), y(D0) + 0.25), ((r * θ) - r, r + y(B))]) → ASegment(B, (x(C_1), y(B))) → c1CircleArc(C_1, (x(C_1), y(B)), P) → c2CircleArc(C_1, P, (x(C_1), y(B))) → eSegment(A, (x(A) + (2 * r), y(A))) → jSequence(Segment[(((2 * i) * r), 0), (((2 * i) * r), (-1 * 0.25))], i, 0, 10) → list1Sequence(Segment[((((2 * i) - 1) * r), 0), ((((2 * i) - 1) * r), (-1 * 0.2))], i, 1, 10) → list2Sequence(Sequence[Segment[((i * r) + ((0.2 * j) * r), 0), ((i * r) + ((0.2 * j) * r), (-1 * 0.15))], j, 1, 4], i, 0, 19) → list3Segment(B, (x(B) + (20 * r), y(B))) → cSequence(Segment[(i, 0), (i, (-1 * 0.25))], i, 0, 10) → list6Sequence(Segment[(((2 * i) - 1) / 2, 0), (((2 * i) - 1) / 2, (-1 * 0.2))], i, 1, 10) → list7Sequence(Sequence[Segment[(i / 2 + (0.1 * j), 0), (i / 2 + (0.1 * j), (-1 * 0.15))], j, 1, 4], i, 0, 19) → list8Sequence(Segment[(((2 * i) - 1) / 20, 0), (((2 * i) - 1) / 20, (-1 * 0.1))], i, 1, 100) → list10Sequence(Segment[((((2 * i) - 1) * r / 10), 0), ((((2 * i) - 1) * r / 10), (-1 * 0.1))], i, 1, 100) → list4Segment((0, 0), (10, 0)) → aSequence(Segment[(((2 * i) - 1) / 200, 0), (((2 * i) - 1) / 200, (-1 * 0.03))], i, 1, 1000) → list11Sequence(Sequence[Segment[(i / 20 + (0.01 * j), 0), (i / 20 + (0.01 * j), (-1 * 0.06))], j, 1, 4], i, 0, 199) → list9Sequence(Sequence[Segment[((i * r / 10) + ((0.02 * j) * r), 0), ((i * r / 10) + ((0.02 * j) * r), (-1 * 0.06))], j, 1, 4], i, 0, 199) → list5Circle((0, r), r) → dCorner(1) → cor1Corner(3) → cor3
AI Drawing Prompt Reference
Draw a diagram showing the proportional relationship between the circumference and diameter of circles, including circles of different sizes with their circumferences and diameters measured. Display the value of pi and the ratio relationships. Use a slider to dynamically adjust the circle sizes and observe the changes in data. The diagram should include circles, diameter lines, circumference lines, coordinate axes, and text labels to illustrate basic circle properties and the meaning of pi.
The prompt above was compiled from the original drawing commands and is for reference only.