
Chi-Square Goodness of Fit Test Visualization
Loading the math board and drawing, please wait…
In collections
学习 GeoGebra 经典应用
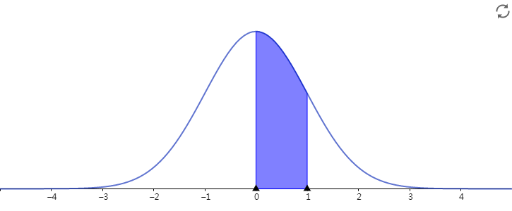
This example demonstrates how to conduct a Chi-Square Goodness of Fit Test by constructing a visual comparison between observed and expected frequencies, showing the statistical process of hypothesis testing. Key mathematical concepts include chi-square statistic, degrees of freedom, significance level, and p-value calculation. Construction points: Use bar charts to display categorical data distribution, employ sliders to dynamically adjust expected proportions, observe how the chi-square value changes and affects test conclusions. Suitable for high school and university statistics courses, helping learners understand hypothesis testing fundamentals, master the steps of goodness of fit testing, and develop data analysis and statistical inference skills.
AI Drawing Prompt Reference
Create a visualization of a Chi-Square Goodness of Fit Test, including bar charts for observed and expected frequencies, and use sliders to dynamically adjust the expected proportions. Observe how the Chi-Square value changes and affects the test conclusions. Start by creating bar charts to display the distribution of categorical data, then add sliders to adjust the expected proportions, and finally plot the Chi-Square value and observe its changes.
The prompt above was compiled from the original drawing commands and is for reference only.