
Changes in Coefficients of Quadratic Equations
Loading the math board and drawing, please wait…
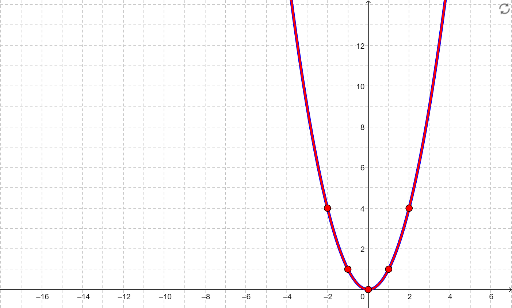
This example demonstrates how changes in the coefficients of a quadratic equation affect the vertex trajectory of the parabola. Key mathematical concepts include quadratic functions, vertex formulas, and the impact of coefficients on the graph. Construction involves using GeoGebra commands like Vertex and Intersect to create the parabola and adjust coefficients to observe vertex movement. Suitable for high school students learning quadratic function properties and coordinate geometry applications.
GeoGebra Commands & Parameters
Vertex(Quadratic_b) → VertexQuadratic, , ,Vertex(Quadratic_r) → VertexQuadratic_r, , ,Intersect(Quadratic_r, YAxis) → XInt1_2, XInt2_2Intersect(Quadratic_b, YAxis) → XInt1, XInt2Intersect(Quadratic_b, Quadratic_r, 1) → ParabInt1Intersect(Quadratic_b, Quadratic_r, 2) → ParabInt2If(Discriminant ≟ 0, "1 Real Root", If[Discriminant > 0, "2 Real Roots", "No Real Roots"]) → NumRoots
AI Drawing Prompt Reference
Draw two parabolas in different colors, mark each vertex, show the points where each parabola meets the y‑axis, indicate the two intersection points of the parabolas, and add a label that states whether the quadratic has one real root, two real roots, or no real roots based on the discriminant; clearly display the vertices, the y‑axis intercepts, and the mutual intersections, and include a dynamic text that updates to show the number of real roots according to the discriminant value.
The prompt above was compiled from the original drawing commands and is for reference only.