
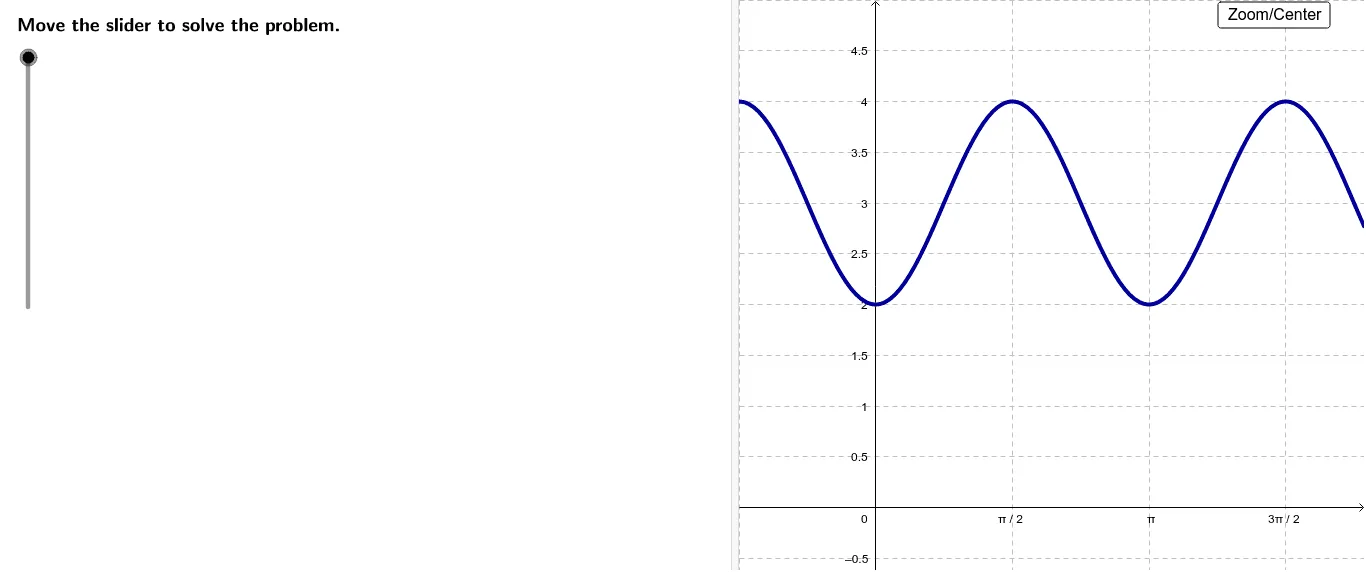
CCGPS AA 5.2.3 Example 3: Write an Equation to Describe the Graphed Function
Loading the math board and drawing, please wait…
In collections
CCGPS AA Unit 5 Lesson 2
This example demonstrates how to write an equation that describes a given function graph, with a focus on the tangent function. The core mathematical concepts include the period, amplitude, phase shift, and vertical shift of the tangent function, and how to extract these parameters from the graph to construct the function expression. In terms of construction, the summary shows the use of GeoGebra commands such as LaTeX, Segment, If, Vector, Min, Max, and TableText, along with multiple sliders (stepMax, stepper, steps, counter) and parameters (a, b, cmult, d, f, period, c, amplitude) to dynamically adjust function parameters. Text objects (text1, cosshiftText, sincmult, sinshiftText, etc.) are used to display the equation derivation process. This example is suitable for high school or pre-university students learning trigonometric function transformations, and can also be used by teachers for classroom demonstrations on how to reverse-engineer a function equation from its graph, fostering visual-symbolic reasoning and reverse thinking.
GeoGebra Commands & Parameters
LaTeX(steps) → counterSegment(A, B) → periodSegment(C, A) → amplitudeLaTeX("\text{Choose to use either the sine or cosine form.}") → text1If(cmult > 0, LaTeX["\text{ to the right}"], If[cmult < 0, LaTeX["\text{ to the left}"], ""]) → cosshiftTextIf(sincmult > 0, LaTeX["\text{ to the right}"], If[sincmult < 0, LaTeX["\text{ to the left}"], ""]) → sinshiftTextLaTeX("\text{Determine the value of a.}") → text7LaTeX("\text{Determine the value of b.}") → text10LaTeX("\text{Determine the value of c.}") → text16LaTeX("\text{The variable c gives the horizontal shift.}") → text17Vector(E, A) → uVector(F, D) → vLaTeX("\text{Determine the value of d.}") → text24LaTeX("\text{The variable d gives the vertical shift.}") → text25If(d > 0, " up", If[d < 0, " down", ""]) → vertshiftTextIf(d > 0, "+", If[d < 0, "-", ""]) → vertshiftSignLaTeX((("\text{The value of d, the vertical shift, is " * d) * ".}")) → text27Vector(((3 * period / 8), 0), ((3 * period / 8), d)) → wLaTeX(("f(x)=" * f)) → text32LaTeX((((((((("f(x)=(" * a) * ")\cos\left[(") * b) * ")(x-") * FractionText[cmult]) * "\pi)\right]+(") * d) * ")")) → text31LaTeX((((((((("f(x)=(" * a) * ")\sin\left[(") * b) * ")(x-") * FractionText[cmult - 0.25]) * "\pi)\right]+(") * d) * ")")) → text35LaTeX(("f(x)=" * g)) → text36Min(0 - a, d - (2 * a)) → yminMax(0 + a, d + (2 * a)) → ymaxLaTeX((((((FractionText[cmult + 2 / b] * "\pi-") * FractionText[cmult]) * "\pi=") * FractionText[2 / b]) * "\pi")) → text13LaTeX("\text{Move the slider to solve the problem.}") → text0LaTeX("\text{This periodic function can be described by a sine function or a cosine function. }\cr\text{Either function will work.}") → text2LaTeX((((((("\text{There is an identifiable rising midpoint at x = }" * FractionText[sincmult]) * "\pi. \cr\text{Thus, this function can be described as a sine function }\cr\text{that has been shifted }") * FractionText[abs(sincmult)]) * "\pi\text{ units}") * sinshiftText) * ".")) → text6LaTeX((((((("\text{There is an identifiable maximum at x = }" * FractionText[cmult]) * "\pi. \cr\text{Thus, this function can be described as a cosine function }\cr\text{that has been shifted } ") * FractionText[abs(cmult)]) * "\pi\text{ units}") * cosshiftText) * ".")) → text4LaTeX("\text{The variable a is the amplitude, or how far the function rises above its midline.}") → text8LaTeX("\text{The period (the length of one cycle of the curve) is equal to }\frac{2\pi}{b}.") → text11LaTeX((((("\text{One cycle of this curve starts at x =}" * FractionText[cmult]) * "\pi\text{ and ends at x = }") * FractionText[cmult + 2 / b]) * "\pi. \cr\text{Subtract to find the length of one cycle of the curve.}")) → text12LaTeX((("\text{The period of the function is }" * FractionText[2 / b]) * "\pi. \cr\text{Substitute this value into the formula for the period of the}\cr\text{function and solve for b.}")) → text14LaTeX("\text{The value of the horizontal shift depends on whether the curve}\cr\text{is viewed as a cosine function or as a sine function.}") → text18LaTeX("\text{In either case, shifts to the right are designated as positive }\cr\text{and shifts to the left are designated as negative.}") → text19LaTeX("\text{Substitute a, b, c, and d into the general form of the cosine or sine function.}") → text28LaTeX("\text{Substitute the known values into the general form of the }\cr\text{cosine function and simplify.}") → text29LaTeX("\text{Use the buttons below to return to the original problem or}\cr\text{randomly generate a similar practice problem.}") → text37LaTeX((((((("\text{The midline is y = }" * d) * "\text{, and the function rises }") * a) * " \text{ unit(s) above its midline. }\cr\text{Therefore, the value of a, the amplitude, is }") * a) * ".")) → text9TableText({{LaTeX["\text{period}=\frac{2\pi}{b}"], LaTeX["\text{Formula for the period}"]}, {LaTeX[(FractionText[2 / b] * "\pi=\frac{2\pi}{b}")], LaTeX["\text{Substitute for the period.}"]}, {LaTeX[(("\left(" * FractionText[2 / b]) * "\pi\right)b=2\pi")], LaTeX["\text{Multiply both sides by b.}"]}, {LaTeX[(("b=\frac{2\pi}{" * FractionText[2 / b]) * "\pi}")], LaTeX["\text{Divide both sides by the period.}"]}, {LaTeX[("b=" * b)], LaTeX["\text{Simplify.}"]}}) → text15LaTeX("\text{As a cosine function:}") → text20LaTeX((("\text{}c=" * FractionText[cmult]) * "\pi")) → text21LaTeX("\text{As a sine function:}") → text22LaTeX((("\text{}c=" * FractionText[cmult - 0.25]) * "\pi")) → text23LaTeX((((((((((("\text{The midline is y = }" * d) * "\text{; thus, the function has been shifted") * vertshiftText) * " ") * abs(d)) * " units (") * vertshiftSign) * "") * d) * ").}")) → text26LaTeX("\text{f(x) = a cos [b(x – c)] + d}") → text30LaTeX("\text{Or, substitute the known values into the general form of the }\cr\text{sine function and simplify.}") → text33LaTeX("\text{f(x) = a sin [b(x – c)] + d}") → text34LaTeX("\text{For cosine form:}") → text3LaTeX("\text{For sine form:}") → text5
AI Drawing Prompt Reference
Draw the graph of a tangent function and show how to extract the period, amplitude, phase shift, and vertical shift parameters from the graph to construct the function expression. Use sliders to dynamically adjust these parameters and display the derivation process and the final function expression. The image should include multiple text objects explaining the meaning and derivation steps of each parameter.
The prompt above was compiled from the original drawing commands and is for reference only.