
Cauchy-Schwarz Inequality for Integrals
Loading the math board and drawing, please wait…
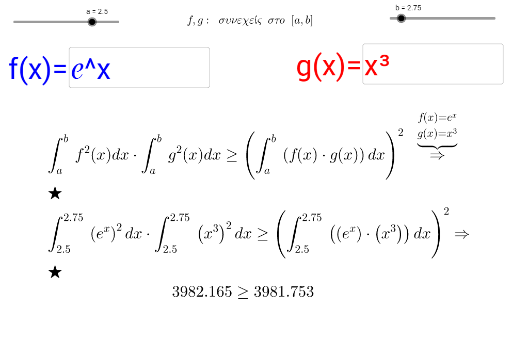
This example demonstrates the Cauchy-Schwarz inequality in the context of integrals. It involves the core mathematical concepts of integrals and inequalities. By constructing the integrals of functions f and g, and their product, it illustrates the geometric meaning of the inequality. Commands used include Textfield, Integral, and objects f, g, a, b, etc. Suitable for high school mathematics education to help students understand the relationship between integrals and inequalities.
GeoGebra Commands & Parameters
Textfield(f) → Εισ1Integral(f(x)^(2), a, b) → ffIntegral(g(x)^(2), a, b) → ggTextfield(g) → Εισ2
AI Drawing Prompt Reference
Create a diagram illustrating the Cauchy-Schwarz inequality for integrals. Show two editable function curves labeled f and g, with their integral regions shaded on the coordinate axes. Include two text input boxes below or beside the graph for entering the expressions of f and g. Additionally, use distinct colors or shading to represent the integrals of f squared, g squared, and the product of f and g, allowing a visual comparison of these integral values to demonstrate the inequality. The layout should be clear for observing the relationship between function variations and integral areas.
The prompt above was compiled from the original drawing commands and is for reference only.