
Capacitor Charging Demonstration
Loading the math board and drawing, please wait…
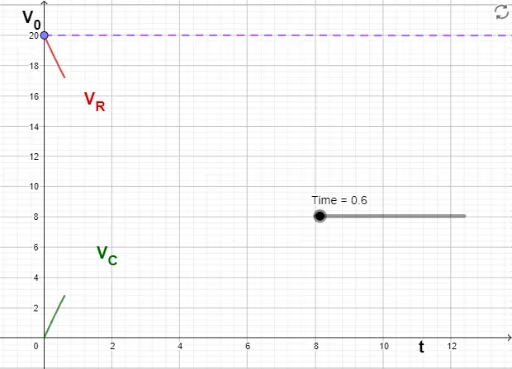
This example demonstrates the dynamic graphical phenomenon of voltage change over time during a capacitor charging process. It involves core mathematical concepts including derivatives, integrals, and function graphing from calculus. The construction uses GeoGebra commands like Point and Segment to plot the time axis and key points, defining objects such as Time, f, g for time-function relationships, and employing text1, text2, text3, A, B, h, text4 for annotations. Suitable for high school physics students or university beginners studying capacitor discharge principles and calculus applications.
GeoGebra Commands & Parameters
Point(yAxis) → ASegment(A, B) → h
AI Drawing Prompt Reference
Draw a dynamic graph showing voltage change over time during a capacitor charging process, including a horizontal time axis with key points marked on it, connected by line segments to form the axis, and labeled appropriately.
The prompt above was compiled from the original drawing commands and is for reference only.