
Camborne Weather Data Histogram
Loading the math board and drawing, please wait…
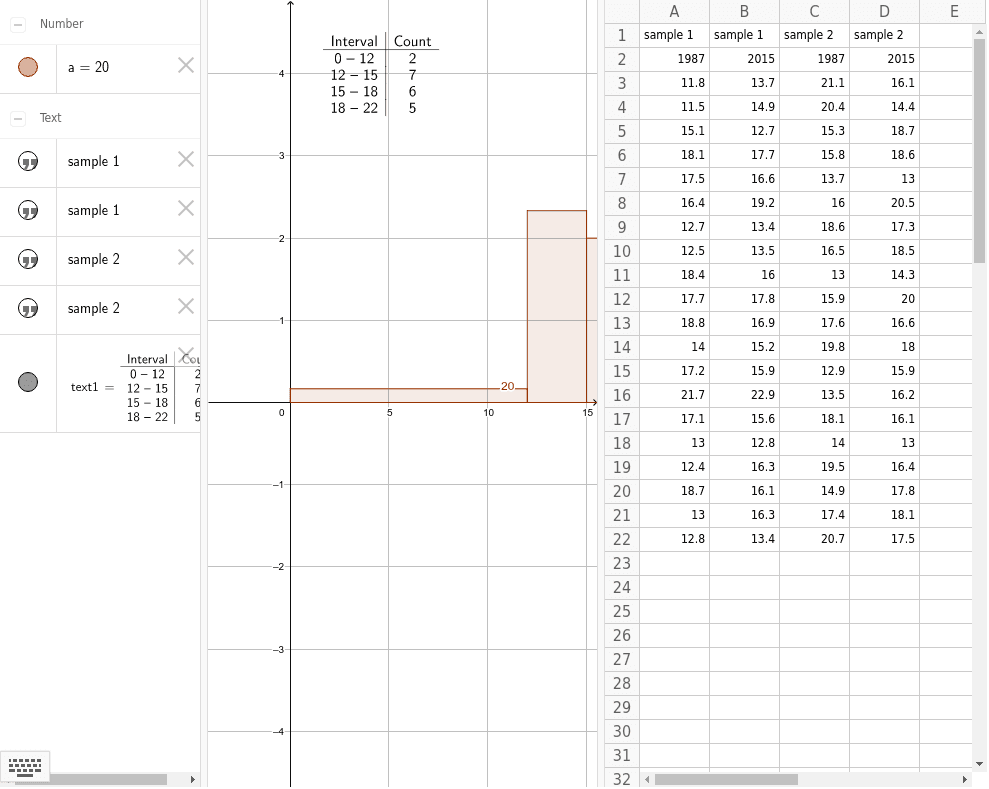
This example demonstrates the histogram of weather data from Camborne using GeoGebra's Histogram and FrequencyTable commands. It covers core concepts in statistics, specifically histogram construction. Suitable for middle school students learning statistics and data visualization.
GeoGebra Commands & Parameters
Histogram({0, 12, 15, 18, 22}, A3:A22, true) → aFrequencyTable({0, 12, 15, 18, 22}, A3:A22) → text1