
Calculus and Limit Demonstration
Loading the math board and drawing, please wait…
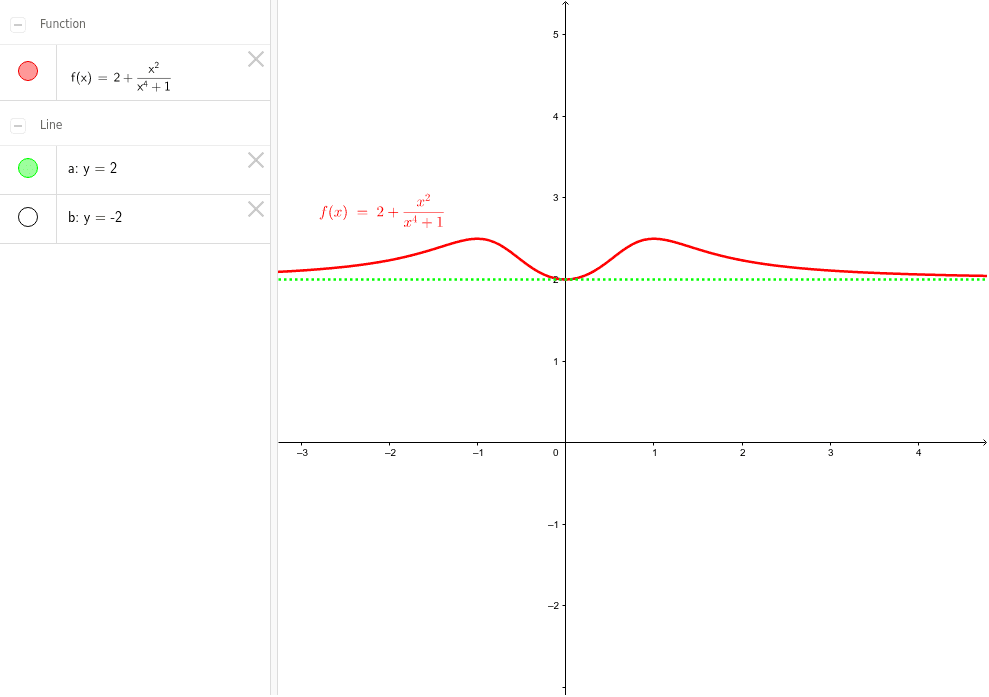
This example dynamically demonstrates the concept of limits in calculus, combining graphical and numerical changes for intuitive presentation. It involves core mathematical concepts such as limits, function graphs, quadratic functions, and transformations. The construction uses GeoGebra commands like objects f (function), a (parameter), and b (parameter). Suitable for high school and above students to understand introductory calculus and applications of function transformations.
GeoGebra Commands & Parameters
f(x) = 2 + x^(2) / (x^(4) + 1)Line a(0.0, 1.0, -2.0)Line b(0.0, 1.0, 2.0)
AI Drawing Prompt Reference
Draw a dynamic graph demonstrating the concept of limits in calculus, featuring a function graph defined as 2 plus x squared over x to the fourth power plus 1, and two horizontal lines at y=1, one extending from x=-2 to x=0 and the other from x=0 to x=2, to illustrate the function's behavior and transformations at limit points.
The prompt above was compiled from the original drawing commands and is for reference only.