
Calculate Mean and Median of Weekly Temperatures
Loading the math board and drawing, please wait…
In collections
CCSS Support Algebra I Unit 3
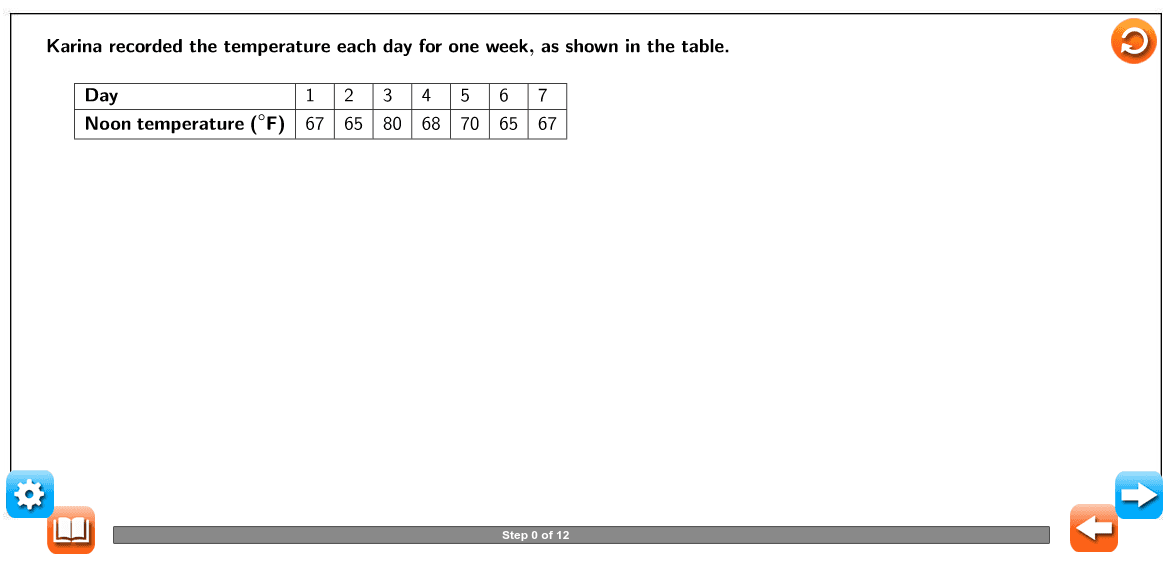
This example demonstrates the temperature data recorded by Karina at noon for one week and requires calculating the mean and median of these data. Key mathematical concepts include the methods of calculating mean and median. Using GeoGebra commands such as Sum, LaTeX, Sort, Element, etc., the process of sorting data, calculation, and results can be visually demonstrated. Suitable for students at junior high school level and above to learn statistical concepts.
GeoGebra Commands & Parameters
Sum({a, b, d, e, f, g, h}) → totalLaTeX((((("\text{ \textcolor{#000099}{=\frac{" * total) * "}{") * 7) * "}}}")) → text6LaTeX("\text{ \textcolor{#000099}{≈}}") → text7LaTeX((("\text{ \textcolor{#000099}{" * average) * "}}")) → text8Sort({a, b, d, e, f, g, h}) → ascendingLaTeX("\text{Find the median temperature.}") → text10LaTeX("\text{Since there are an odd number of values, the median is the temperature in the middle.}") → text13Element(ascending, 1) → sort1Element(ascending, 2) → sort2Element(ascending, 3) → sort3Element(ascending, 4) → sort4Element(ascending, 5) → sort5Element(ascending, 6) → sort6Element(ascending, 7) → sort7TableText({{LaTeX[(("\text{ \textcolor{#000099}{" * sort1) * "}}")], LaTeX[(("\text{ \textcolor{#000099}{" * sort2) * "}}")], LaTeX[(("\text{ \textcolor{#000099}{" * sort3) * "}}")], LaTeX[(("\text{ \textcolor{#000099}{" * sort4) * "}}")], LaTeX[(("\text{ \textcolor{#000099}{" * sort5) * "}}")], LaTeX[(("\text{ \textcolor{#000099}{" * sort6) * "}}")], LaTeX[(("\text{ \textcolor{#000099}{" * sort7) * "}}")]}}, "h") → text12TableText({{LaTeX[(("\text{ \textcolor{#000099}{" * sort1) * "}}")], LaTeX[(("\text{ \textcolor{#000099}{" * sort2) * "}}")], LaTeX[(("\text{ \textcolor{#000099}{" * sort3) * "}}")], LaTeX[(("\text{ \textcolor{#000099}{" * sort4) * "}}")], LaTeX[(("\text{ \textcolor{#000099}{" * sort5) * "}}")], LaTeX[(("\text{ \textcolor{#000099}{" * sort6) * "}}")], LaTeX[(("\text{ \textcolor{#000099}{" * sort7) * "}}")]}}, "h") → text14Median({a, b, d, e, f, g, h}) → medianLaTeX((("\text{The median temperature is \textcolor{#000099}{" * median) * "° F}.}")) → text15LaTeX((("\text{" * a) * "}")) → text16LaTeX((("\text{" * b) * "}")) → text17LaTeX((("\text{" * d) * "}")) → text18LaTeX((("\text{" * e) * "}")) → text19LaTeX((("\text{" * f) * "}")) → text20LaTeX((("\text{" * g) * "}")) → text21LaTeX((("\text{" * h) * "}")) → text22Mean({a, b, d, e, f, g, h}) → meanLaTeX("\text{Find the mean temperature.}") → text4LaTeX("\text{To find the mean, add the temperatures, then divide the result by the number of temperatures recorded, \textcolor{#000099}{ 7}.}") → text4_1LaTeX((((((((((((((((("\text{ \textcolor{#000099}{\frac{" * a) * "+") * b) * "+") * d) * "+") * e) * "+") * f) * "+") * g) * "+") * h) * "}{") * 7) * "}}}")) → text5LaTeX("\text{To find the median, first order the data set from least to greatest:}") → text11TableText({{LaTeX["\mathbf{Day}"], LaTeX["\text{1}"], LaTeX["\text{2}"], LaTeX["\text{3}"], LaTeX["\text{4}"], LaTeX["\text{5}"], LaTeX["\text{6}"], LaTeX["\text{7}"]}, {LaTeX["\mathbf{Noon \;temperature \;(° F)}"], LaTeX[(("\text{" * a) * "}")], LaTeX[(("\text{" * b) * "}")], LaTeX[(("\text{" * d) * "}")], LaTeX[(("\text{" * e) * "}")], LaTeX[(("\text{" * f) * "}")], LaTeX[(("\text{" * g) * "}")], LaTeX[(("\text{" * h) * "}")]}}, "l|_") → TabletextLaTeX("\text{Karina recorded the temperature each day for one week, as shown in the table.}") → QuestionLaTeX("\text{\mathbf{mean} the average value of a data set, found by summing all values and dividing by}") → text27LaTeX("\text{the number of data points}") → text2LaTeX("\text{and 50% is greater than it.}") → text3LaTeX("\text{\mathbf{median} the middle-most value of a data set; 50% of the data is less than this value, }") → text28LaTeX((("\text{The mean temperature is approximately \textcolor{#000099}{" * average) * "° F}.}")) → text9
AI Drawing Prompt Reference
Create a table showing the noon temperature for each day of the week from lowest to highest. Then calculate and label the mean and median temperatures. The mean temperature is the sum of all temperatures divided by 7, and the median temperature is the middle temperature in the sorted list.
The prompt above was compiled from the original drawing commands and is for reference only.