
C4.1 Absolute Maximum and Absolute Minimum Ex 2
Loading the math board and drawing, please wait…
In collections
Calculus 1 Graphical Illustrations
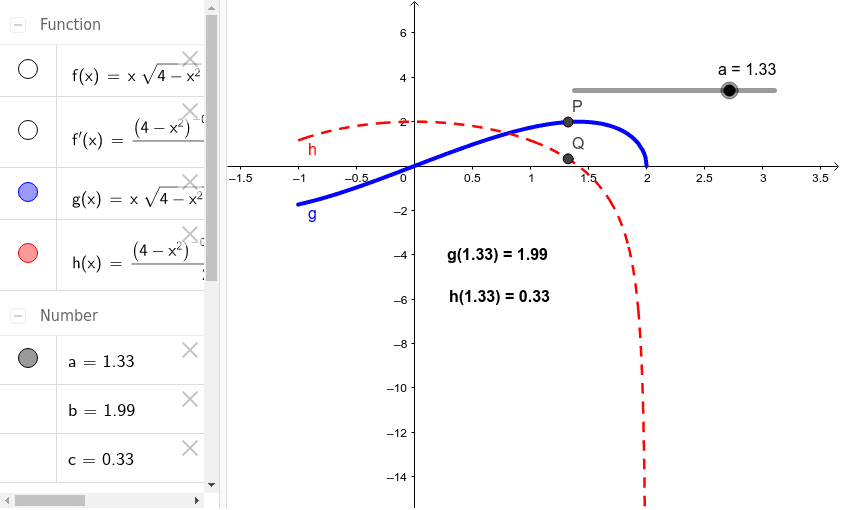
①This example demonstrates how to visually locate the absolute maximum and absolute minimum of a function on a closed interval by examining both the function graph and its derivative graph. ②The core mathematical concepts include the Extreme Value Theorem for continuous functions on closed intervals, using derivatives to find critical points, comparing endpoint values with critical values, and applying these ideas to piecewise functions, circles, cylinders, and logarithmic functions. ③Construction highlights: based on the construction summary, GeoGebra objects include the function f and its derivative f', points a, P, Q, b, c marking key locations, text objects text1 and text2 displaying numerical results, and auxiliary functions g and h for constructing or comparing different functions. The overall setup integrates function graphs, derivative graphs, and geometric objects such as circles and cylinders. ④This is suitable for senior high school or introductory college calculus students to understand the geometric meaning and algebraic procedure of optimization problems, and can serve as an interactive classroom demonstration for teachers.
GeoGebra Commands & Parameters
f(x) = (x * sqrt(4 - x^(2)))f'(x) = f'(x)Numeric a(1.325)(a, f(a))(a, f'(a))y(P)y(Q)g(x) = If[-1 ≤ x ≤ 2,f]h(x) = If[-1 ≤ x ≤ 2,f']
AI Drawing Prompt Reference
Draw the graphs of the function f(x) = x * sqrt(4 - x^2) and its derivative f'(x). Mark key points a, P, Q, b, c on the function graph and label numerical results with text. Use auxiliary functions g and h for comparison. The overall setup illustrates the absolute maximum and minimum of a function on a closed interval, combining geometric and algebraic optimization concepts.
The prompt above was compiled from the original drawing commands and is for reference only.