
Section 2.6 Horizontal and Vertical Asymptotes
Loading the math board and drawing, please wait…
In collections
Calculus 1 Graphical Illustrations
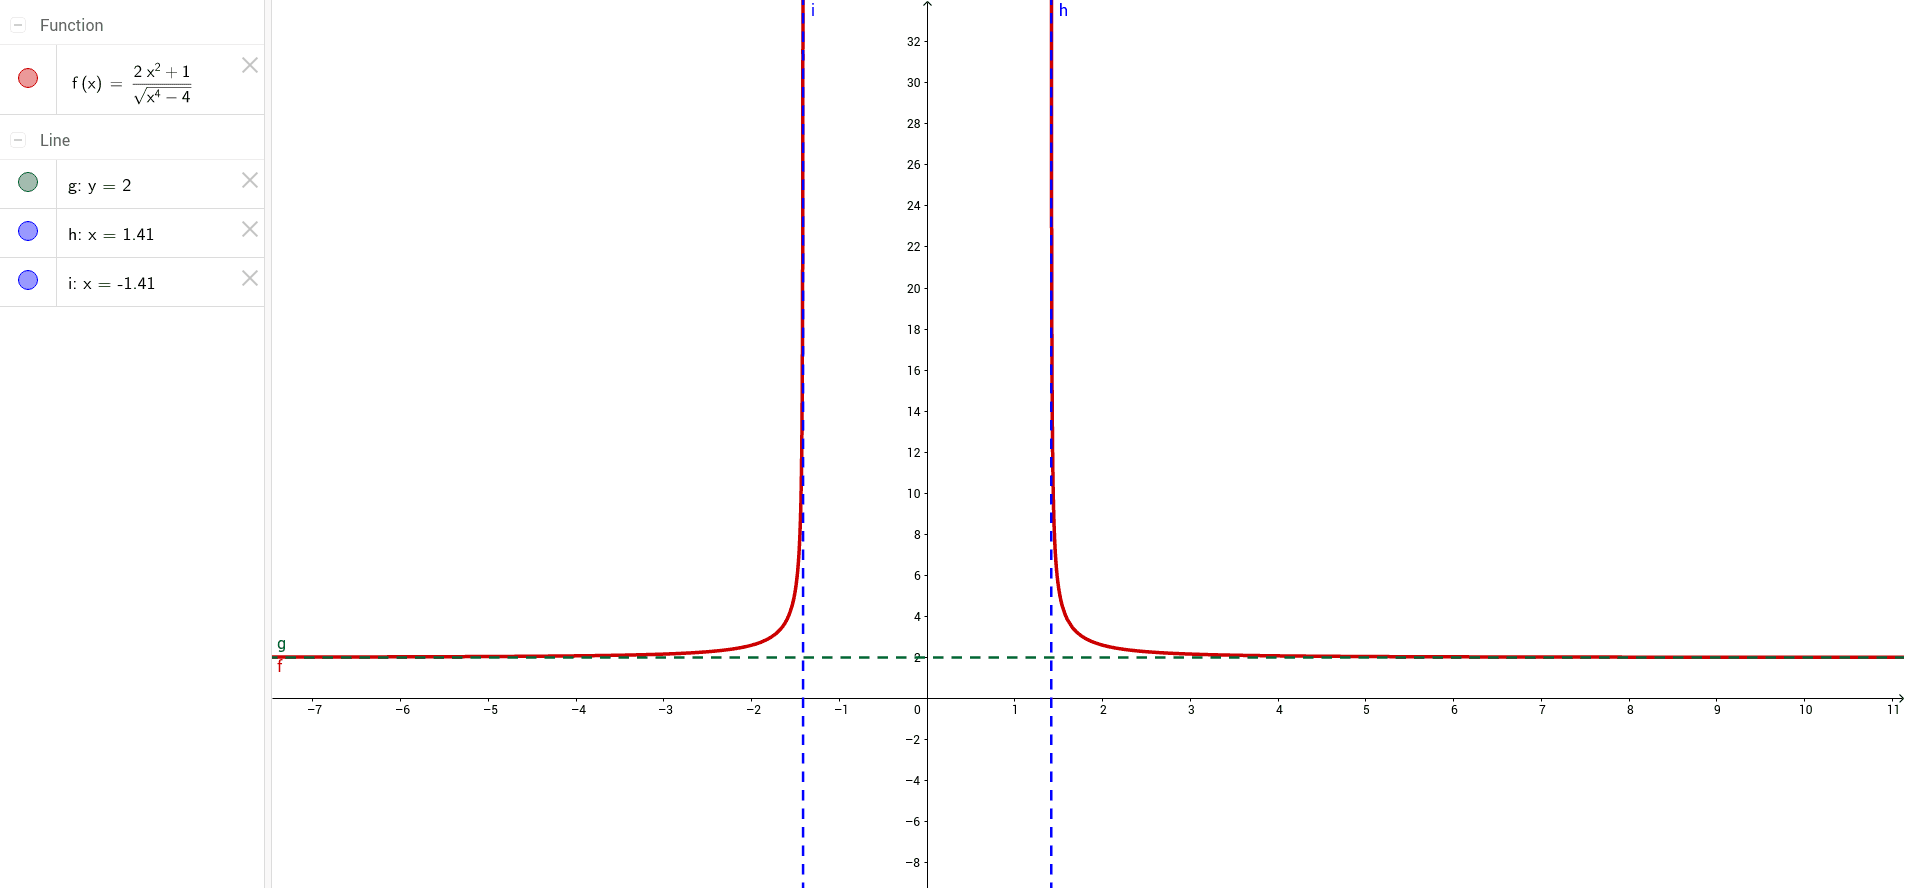
①This example demonstrates how to visually identify horizontal and vertical asymptotes on function graphs, clarifying the behavior of functions at infinity or near singular points. ②Core mathematical concepts include the definition of asymptotes, limits of rational functions, and the relationship between graphs and asymptotes. ③Construction highlights: the summary lists objects f, g, h, i, likely representing function expressions, asymptote lines, or auxiliary points, using GeoGebra's graphing capabilities to show the relative positions of curves and asymptotes. ④Suitable for high school or college pre-calculus courses, useful for teaching the geometric meaning of limits and asymptotes, and for classroom demonstrations or student self-exploration.
GeoGebra Commands & Parameters
f(x) = ((2 * x^(2)) + 1) / sqrt(x^(4) - 4)y = 2x = sqrt(2)x = (-sqrt(2))