
Boxplot with Two Data Sets
Loading the math board and drawing, please wait…
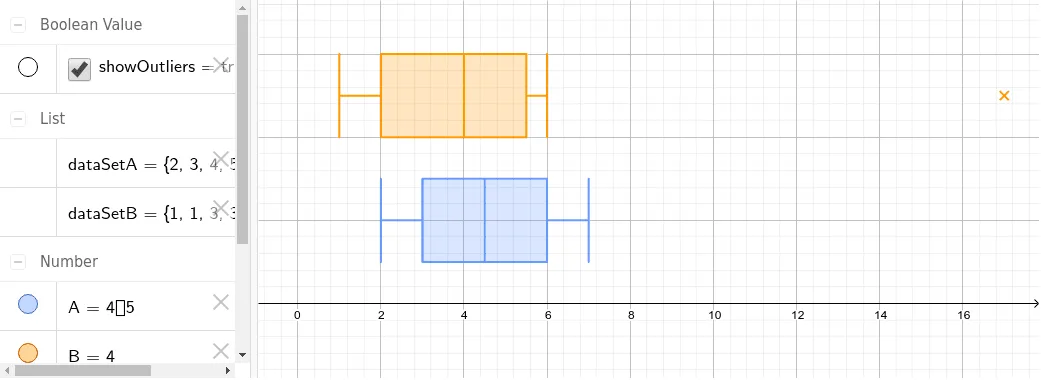
This example demonstrates how to create a boxplot with two data sets using GeoGebra, visually comparing the distribution characteristics of two data groups. Core math concepts include statistical charts (boxplot), data distribution, median, quartiles, and outliers. Construction highlights involve using the GeoGebra command BoxPlot to generate the boxplot, with controls like yOffsetA, yScale, showOutliers for displaying two data sets (dataSetA, dataSetB) and outliers, and sliders A, B for parameter adjustment. Suitable for high school statistics teaching, aiding in understanding data visualization and comparative analysis.
GeoGebra Commands & Parameters
BoxPlot(yOffsetA, yScale, dataSetA, showOutliers) → ABoxPlot(yOffsetB, yScale, dataSetB, showOutliers) → B