
BoxPlot Statistical Characteristics Demo
Loading the math board and drawing, please wait…
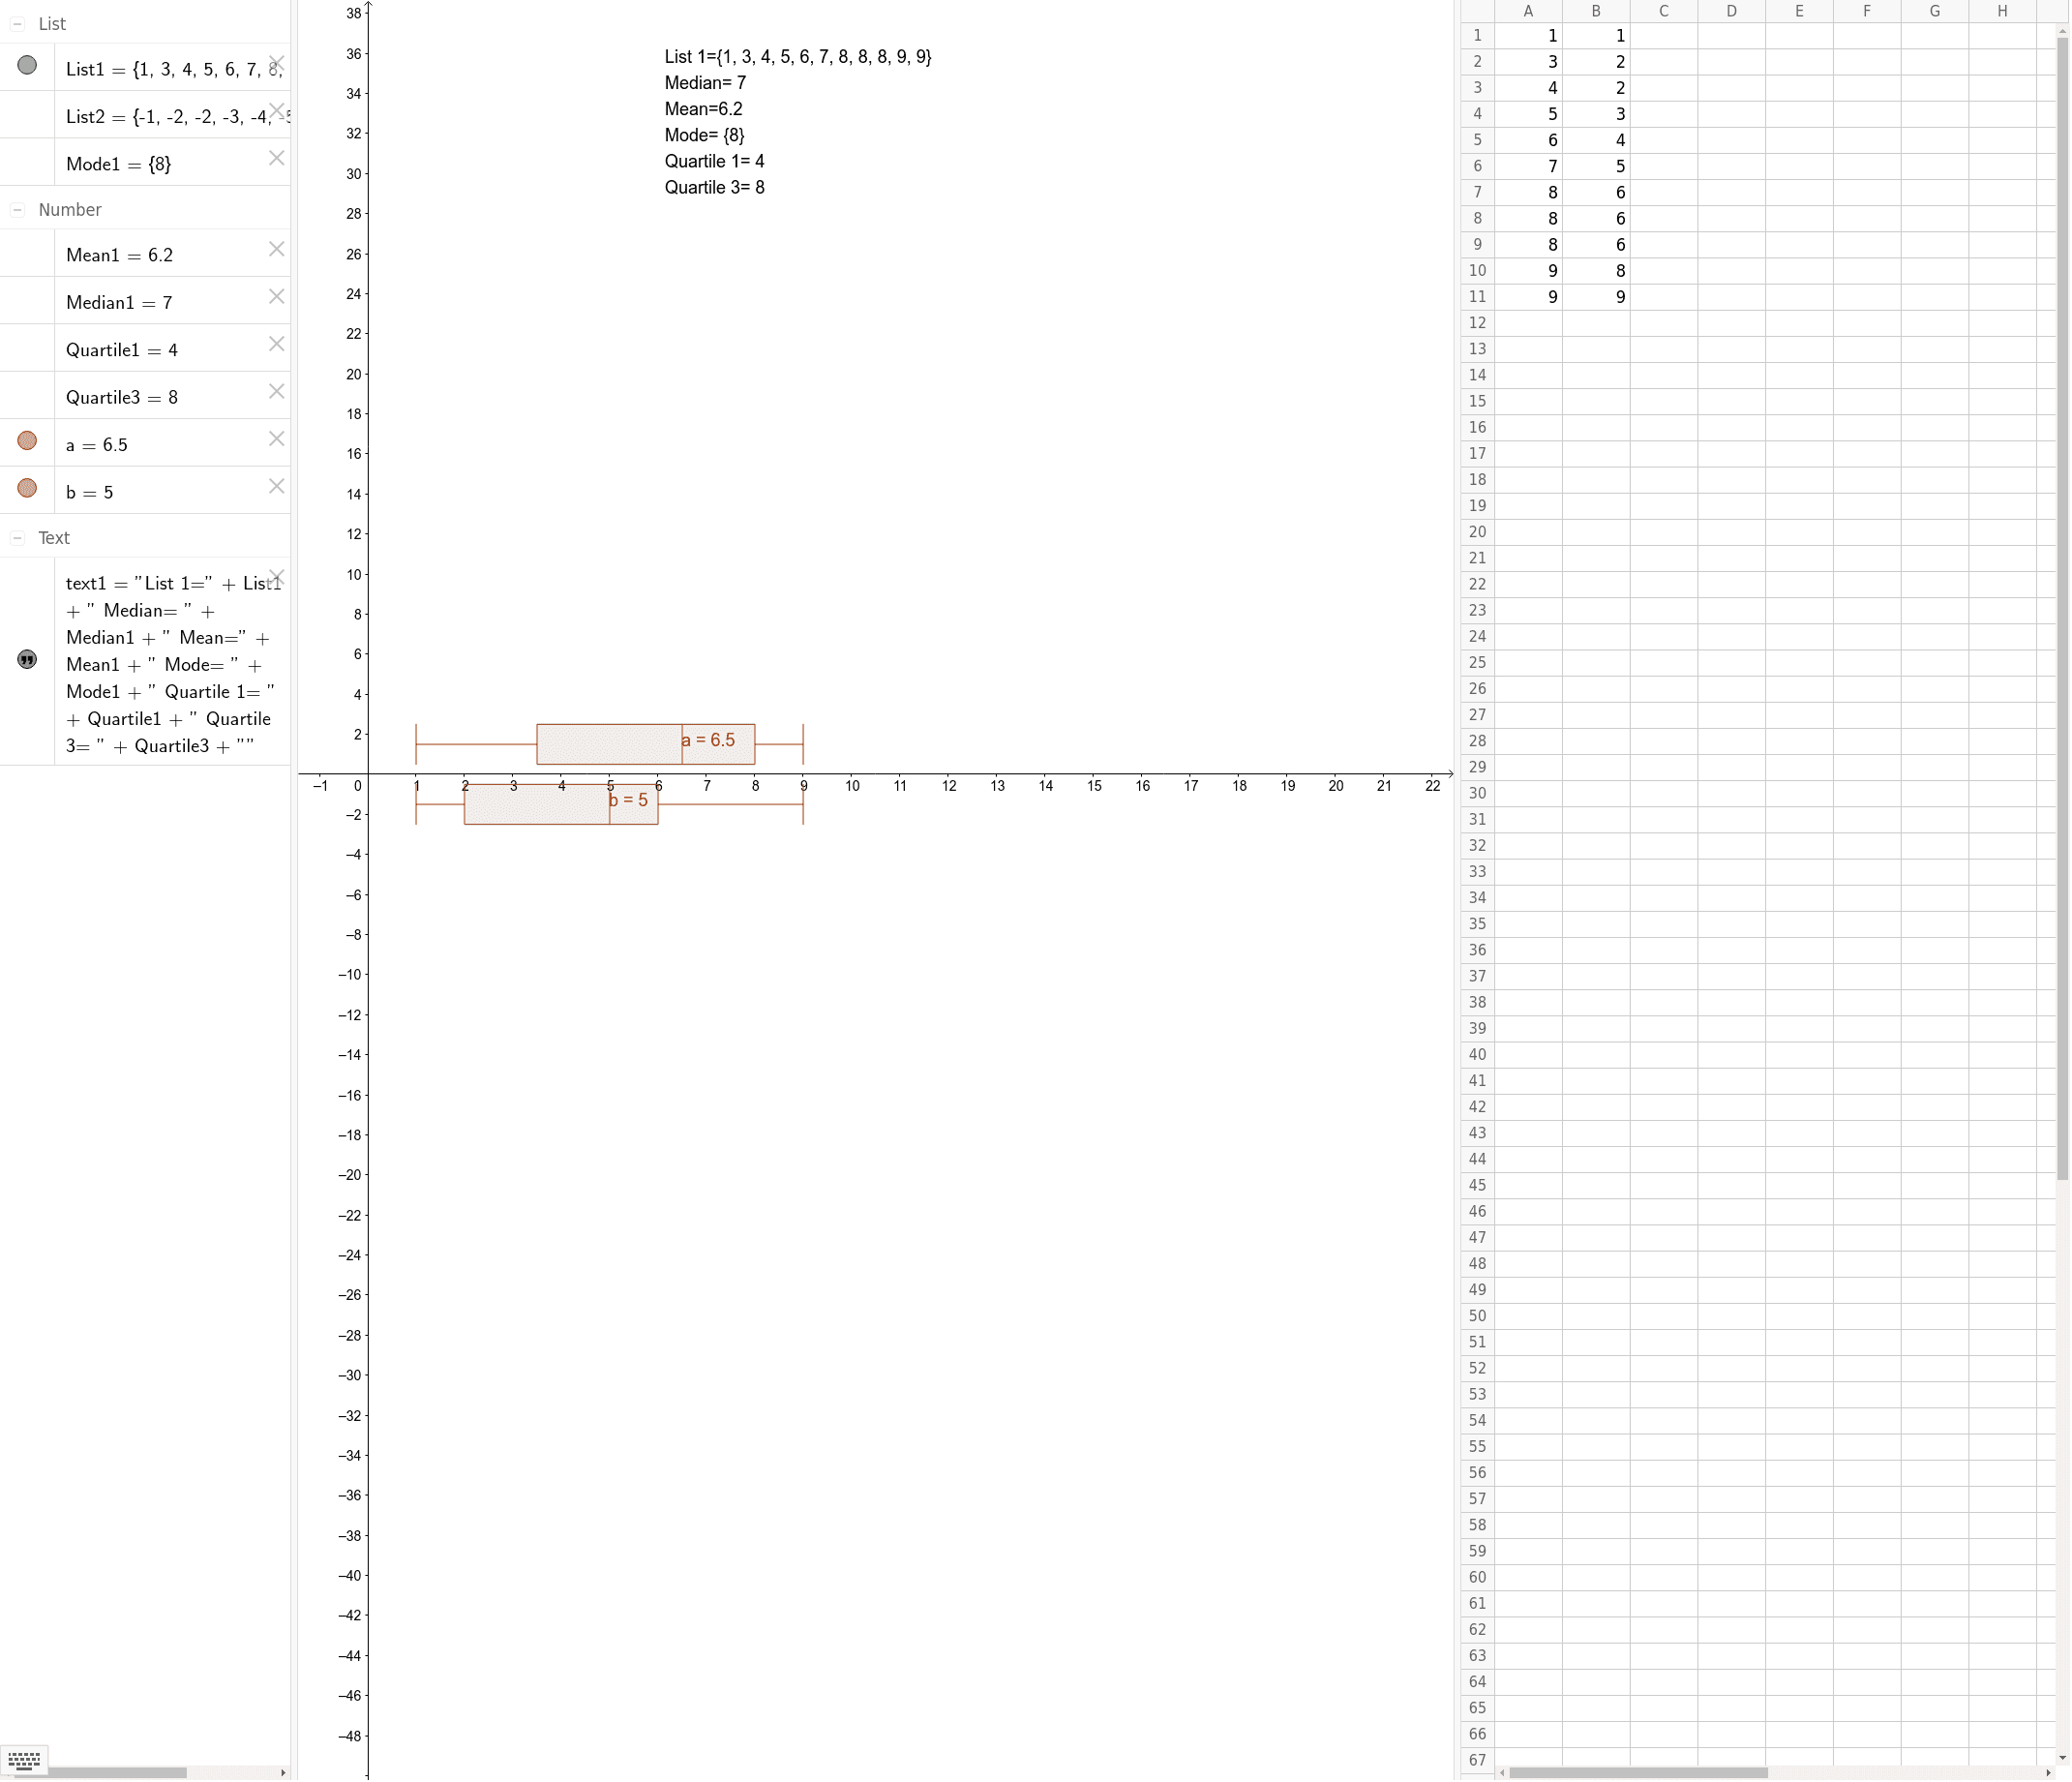
This example demonstrates how to use GeoGebra to create box plots and display statistical characteristics of datasets. It involves core math concepts like box plots, mean, median, mode, Q1, Q3. Construction highlights include commands like BoxPlot, Mean, Median, Mode, Q1, Q3. Suitable for high school and above, ideal for probability & statistics education.
GeoGebra Commands & Parameters
BoxPlot(1.5, 1, {1, 2, 3, 4, 5, 6, 7, 8, 8, 8, 9, 9}) → aBoxPlot(-1.5, 1, {1, 2, 2, 3, 4, 5, 6, 6, 6, 8, 9}) → bMean({1, 3, 4, 5, 6, 7, 8, 8, 8, 9, 9}) → Mean1Median(List1) → Median1Mode(List1) → Mode1Q1(List1) → Quartile1Q3(List1) → Quartile3
AI Drawing Prompt Reference
Draw two box plots to display the statistical characteristics of different datasets, including median, mean, mode, and quartiles, and label the mean and median for each dataset to compare the distribution of the two groups.
The prompt above was compiled from the original drawing commands and is for reference only.