
Box Plots Practice: Statistical Visualization via Geometric Construction
Loading the math board and drawing, please wait…
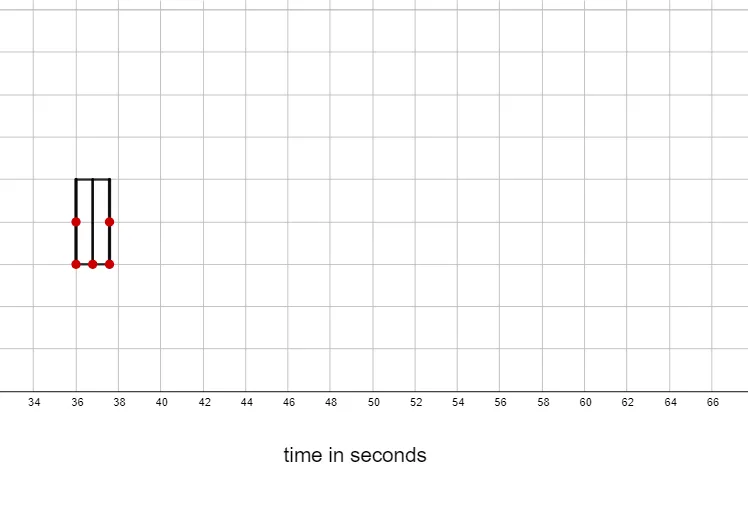
This GeoGebra example demonstrates how to construct a box plot using geometric construction tools, visualizing the five-number summary (minimum, lower quartile, median, upper quartile, maximum) in a graphical form. The core mathematical concepts include the definition of box plots, calculation of quartiles, and visualization of data distribution. Construction highlights: based on the summary, it uses Polygon to draw the box, Segment for the whiskers, and Intersect to determine key points; objects include multiple points (A, B, C, D, etc.), segments (a, d, b, c, e, etc.), and text labels (text1), precisely representing statistical measures through geometric relationships. Suitable for middle school advanced or high school introductory statistics, also useful for teachers to demonstrate the step-by-step construction of box plots, helping students intuitively understand data distribution characteristics.
GeoGebra Commands & Parameters
Polygon(H, G, I, J) → q1, h, g, i, jPolygon(J, L, K, I) → q2, j_1, l, k, i_1Segment(A, D) → fSegment(C, A) → mSegment(B, A) → nSegment(F, D) → pSegment(E, D) → qIntersect(h, f) → MIntersect(l, f) → NSegment(M, A) → rSegment(N, D) → s
AI Drawing Prompt Reference
Draw a box plot with a horizontal baseline. Above the baseline, construct two adjacent rectangular boxes representing the ranges from the lower quartile to the median and from the median to the upper quartile. Extend whiskers from the boxes' sides to the minimum and maximum values. Mark five key data points on the baselinecars, and connect the box boundaries to the baseline with vertical segments. Construction order: draw the baseline, place the five points, then draw the two boxes, and finally add whiskers and connecting segments.
The prompt above was compiled from the original drawing commands and is for reference only.