
Box Plot and Statistics Demonstration
Loading the math board and drawing, please wait…
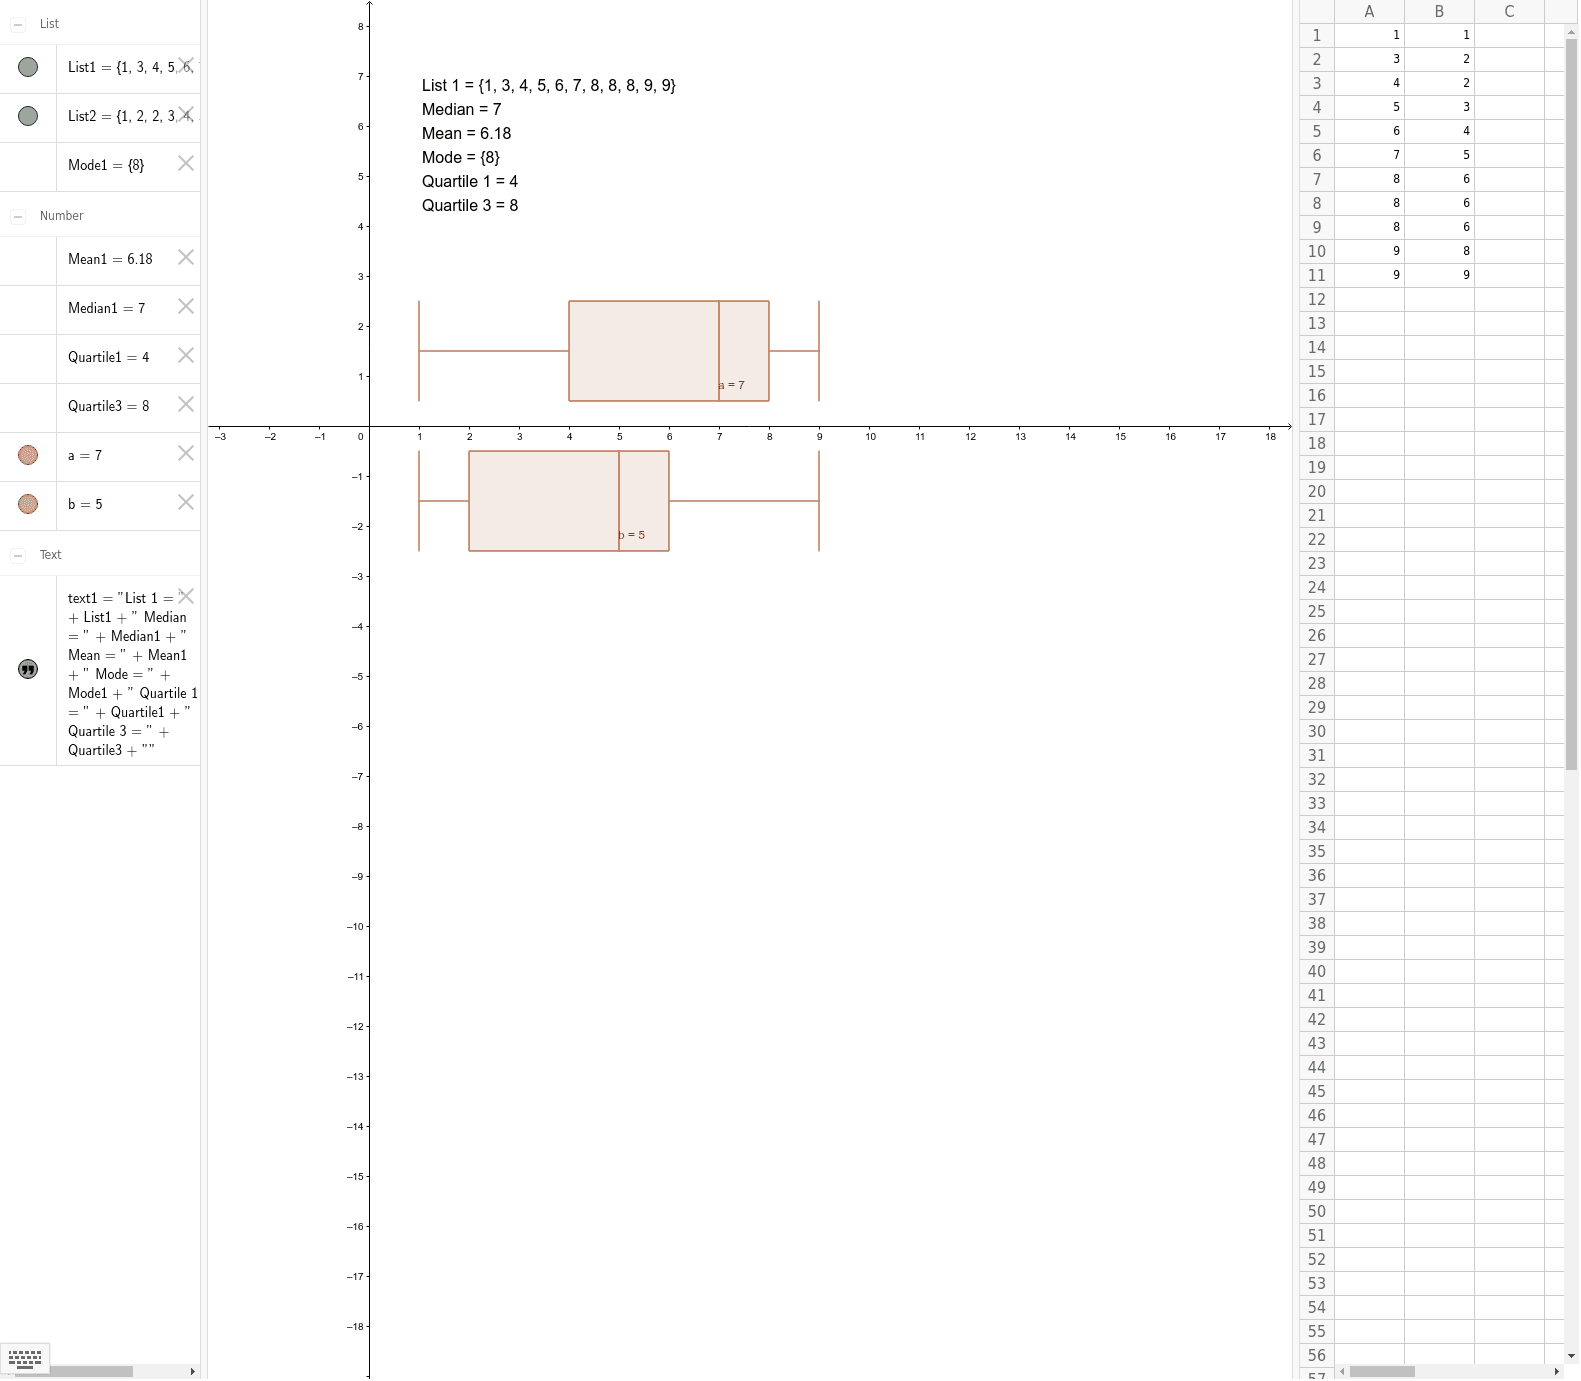
This example demonstrates how to use GeoGebra to create box plots and display statistics such as mean, median, mode, and quartiles. The core mathematical concepts involved include box plots, probability & statistics, data distribution, central tendency, and dispersion. Key GeoGebra commands used are BoxPlot for plotting, Mean, Median, Mode for calculating statistics, and Quartile1, Quartile3 for quartile calculations. Data is stored in List1 and List2, with parameters a and b for adjustments. Suitable for high school and above students learning data analysis and statistical graphing, or for classroom demonstrations.
GeoGebra Commands & Parameters
BoxPlot(1.5, 1, List1) → aBoxPlot(-1.5, 1, List2) → bMean(List1) → Mean1Median(List1) → Median1Mode(List1) → Mode1Q1(List1) → Quartile1Q3(List1) → Quartile3