
Bivariate Statistics: Fast Correlation and Regression Computations
Loading the math board and drawing, please wait…
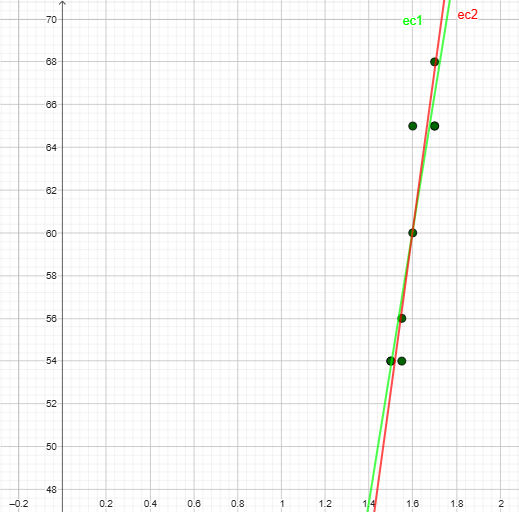
This GeoGebra example demonstrates how to quickly compute and display key results for two statistical variables within a single interactive workflow. It covers the full pipeline from data handling to covariance and correlation (via PMCC), supporting linear correlation/regression analysis. The main concepts include descriptive statistics in two variables—mean, variance, population/sample standard deviation—as well as covariance and the Pearson correlation coefficient used in regression-related inference. Construction-wise, it uses commands such as Unique, Sequence, Transpose, Length, and Append to generate and organize data; TableText and Textfield to present results and accept inputs; Sum, mean, Variance, stdevp, stdev, and Covariance to compute statistical measures; and PMCC to calculate the correlation metric. Objects like the input field (CasillaDeEntrada1), multiple text outputs (texto1–texto6), and parameter/data holders (e.g., mx, my, varx, desvx) are organized to create an input→compute→visualize statistical panel. Suitable for secondary school and early university probability & statistics classes, regression/correlation practice, and classroom demonstrations of how correlation changes with the underlying data.
GeoGebra Commands & Parameters
Unique(Sequence[(l1(i) * (1, 0)), i, 1, Length[l1]]) → l2Unique(Sequence[(l1(i) * (0, 1)), i, 1, Length[l1]]) → l3Sequence(Sequence[Sequence[(l2(i), l3(j)) ≟ l1(k), k, 1, Length[l1]], j, 1, Length[l3]], i, 1, Length[l2]) → l4, {{{true, false, false, false, false, false, false, true, false}, {false, false, false, false, false, false, false, false, false}, {false, false, false, false, false, false, false, false, false}, {false, false, false, false, false, false, false, false, false}, {false, false, false, false, false, false, false, false, false}}, {{false, false, false, false, false, false, false, false, true}, {false, true, false, false, false, false, false, false, false}, {false, false, false, false, false, false, false, false, false}, {false, false, false, false, false, false, false, false, false}, {false, false, false, false, false, false, false, false, false}}, {{false, false, false, false, false, false, false, false, false}, {false, false, false, false, false, false, false, false, false}, {false, false, true, false, false, false, false, false, false}, {false, false, false, true, false, false, false, false, false}, {false, false, false, false, false, false, false, false, false}}, {{false, false, false, false, false, false, false, false, false}, {false, false, false, false, false, false, false, false, false}, {false, false, false, false, false, false, false, false, false}, {false, false, false, false, true, true, false, false, false}, {false, false, false, false, false, false, true, false, false}}}Sequence(Sequence[Sum[l4(i, j)], j, 1, Length[l3]], i, 1, Length[l2]) → m, {{2, 0, 0, 0, 0}, {1, 1, 0, 0, 0}, {0, 0, 1, 1, 0}, {0, 0, 0, 2, 1}}Transpose(m) → m1Length(l2) → nAppend("", l2) → l5Sequence(Sum[m1(i)], i, 1, Length[l3]) → l8Append(Append[l3(1), Sequence[m1(1, j), j, 1, n]], l8(1)) → f1Append(Append[l3(2), Sequence[m1(2, j), j, 1, n]], l8(2)) → f2Append(Append[l3(3), Sequence[m1(3, j), j, 1, n]], l8(3)) → f3Append(Append[l3(4), Sequence[m1(4, j), j, 1, n]], l8(4)) → f4Append(Append[l3(5), Sequence[m1(5, j), j, 1, n]], l8(5)) → f5Append("", Sequence[Sum[m(i)], i, 1, Length[l2]]) → l6Textfield(l1) → CasillaDeEntrada1Sequence(Append[Append[l3(i), Sequence[m1(i, j), j, 1, n]], l8(i)], i, 1, Length[l3]) → m2Transpose(m2) → m3Sequence(Append[Append[l5(i), Sequence[m3(i, j), j, 1, Length[l3]]], l6(i)], i, 1, Length[l2] + 2) → m4TableText(Transpose[m4], "c_|v") → texto1Sum(Sequence[Sum[m(i)], i, 1, Length[l2]]) → aSequence(Sum[m(i)], i, 1, Length[l2]) → l9Sequence((l9(i) * l2(i)), i, 1, Length[l2]) → l10, {3, 3.1, 3.2, 5.1}Sum(l10) → bSequence(((l9(i) * l2(i)) * l2(i)), i, 1, Length[l2]) → l11, {4.5, 4.805000000000001, 5.120000000000001, 8.67}Sum(l11) → cTableText(Append[Append["X_i", l2], "N"], Append[Append["f_i", Sequence[Sum[m(i)], i, 1, Length[l2]]], a], Append[Append["x_i·f_i", l10], b], Append[Append["x_i^2·f_i", l11], c], "v_|c") → texto4Sequence((l3(j) * l8(j)), j, 1, Length[l3]) → l12, {162, 56, 60, 195, 68}Sum(l12) → dSequence(((l3(j) * l8(j)) * l8(j)), j, 1, Length[l3]) → l13, {486, 56, 60, 585, 68}Sum(l13) → eTableText(Append[Append["Y_j", l3], "N"], Append[Append["f_j", Sequence[Sum[m1(i)], i, 1, Length[l3]]], Sum[l8]], Append[Append["y_j·f_j", l12], d], Append[Append["y_j^2·f_j", l13], e], "v_|c") → texto6mean(l2, l9) → mxVariance(l2, l9) → varxstdevp(l2, l9) → desvxmean(l3, l8) → myVariance(l3, l8) → varystdev(l3, l8) → desvyCovariance(l1) → covPMCC(l1) → cregreSequence("f" + (i) + "=Append(Append(l3(" + (i) + "),Sequence(m1(" + (i) + ",j),j,1,n)),l8(" + (i) + "))", i, 1, Length[l2] + 1) → l7
AI Drawing Prompt Reference
Please draw a bivariate statistics calculation panel. The panel includes an input box for data entry, two tables showing statistics for X and Y, and multiple text labels displaying statistical measures. The input box is connected to the calculation process, and results are filled into tables and text. The construction order is: first create the input box, generate data sequences, compute mean, variance, standard deviation, covariance, and correlation coefficient, and finally display results in tables and text.
The prompt above was compiled from the original drawing commands and is for reference only.