
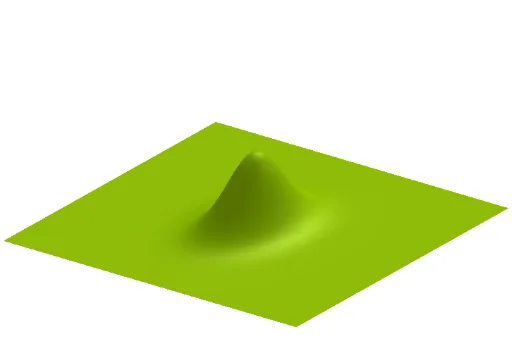
Bivariate Normal Distribution 3D Plot
Loading the math board and drawing, please wait…
This example demonstrates the 3D plot of a bivariate normal distribution with adjustable parameters via sliders. Key math concepts include probability & statistics, 3D geometry, and normal distribution. It utilizes GeoGebra objects like sig1 (std dev 1), sig2 (std dev 2), rho (correlation), and f (function) for construction. Ideal for high school students and math enthusiasts exploring multivariate analysis and 3D visualization.
GeoGebra Commands & Parameters
Numeric sig1(0.5)Numeric sig2(0.3)Numeric rho(0)f(x, y) = 1 / ((((((2 * ℯ^((x^(2) / ((2 * sig1^(2))) + y^(2) / ((2 * sig2^(2))) - (((x * y) * rho)) / ((sig1 * sig2))) / (1 - rho^(2)))) * π) * sqrt(1 - rho^(2))) * sig1) * sig2))