
Binomial Distribution with Standard Deviation and Z-Score
Loading the math board and drawing, please wait…
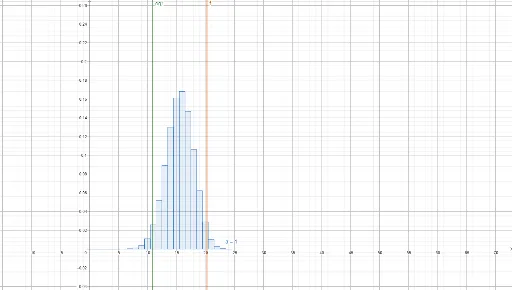
This example demonstrates the probability distribution of a binomial distribution and shows how to calculate standard deviation and z-score. It covers key concepts such as probability, expected value, and variance. Using GeoGebra commands like BinomialDist, E, var, and stdv, it provides a visual understanding of these concepts. Suitable for high school mathematics education and students learning probability and statistics.
GeoGebra Commands & Parameters
BinomialDist(n, p) → aBinomialDist(n, p, low…high) → c