
Histogram of Children Chasing Unicorn
Loading the math board and drawing, please wait…
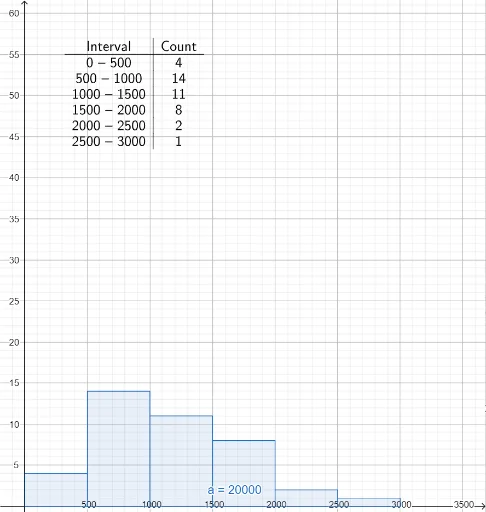
This example uses a histogram to demonstrate children chasing a unicorn. It involves histogram, trigonometric functions, and frequency table. Commands used include Sort, Sequence, Classes, FrequencyTable, and Histogram. Suitable for high school mathematics, particularly statistics and probability.
GeoGebra Commands & Parameters
Sort(Feet) → l1Sequence(0, 3000, 500) → l3Classes(Feet, 6) → l4Classes(Feet, 0, 500) → boundariesFrequencyTable(l3, Feet) → text1Histogram(l3, Feet, false) → aHistogram(l3, Feet) → DensityMeansDivideby500FrequencyTable(true, l3, Feet) → text2Histogram(true, l3, Feet, false) → bFrequencyTable(boundaries, Feet, true, 500 / 40) → text3FrequencyTable(true, boundaries, Feet, true, 500 / 40) → text4
AI Drawing Prompt Reference
Create a statistical chart themed 'Children Chasing Unicorn'. The main element is a histogram with horizontal axis representing distance in feet and vertical axis showing frequency. Data are grouped into 6 intervals of 500 feet each. The histogram has two variants: one showing raw frequencies, another showing density (frequency divided by bin width). Additionally, include frequency distribution tables listing counts per group, plus a finer table with 40-foot subdivisions. Arrange the chart to clearly display data distribution, with a mathematical feel suitable for probability and statistics.
The prompt above was compiled from the original drawing commands and is for reference only.