
Binomial Distribution Simulation by a.zampa
Loading the math board and drawing, please wait…
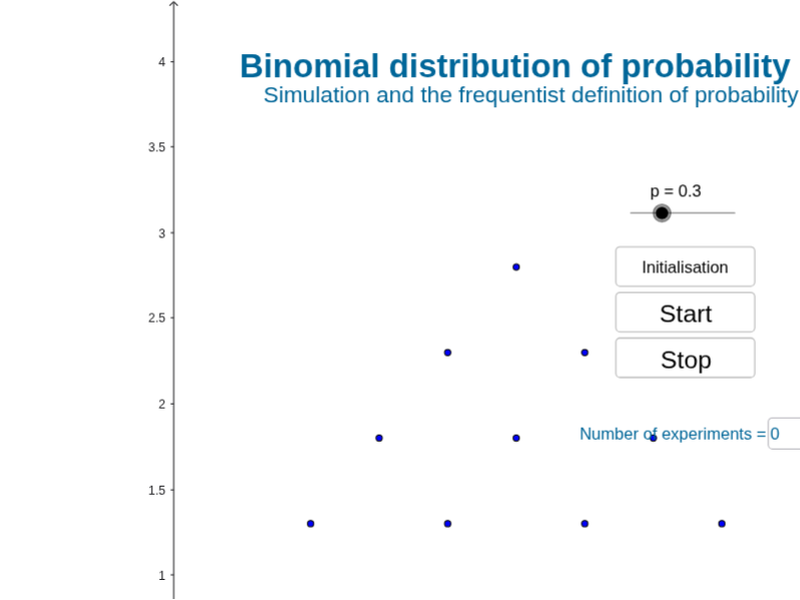
This applet simulates a binomial distribution B_{4,p} through coin tossing experiments to explain the frequentist definition. It demonstrates the concept of binomial distribution in probability theory, using commands like BinomialDist and Histogram in GeoGebra. Suitable for high school math education, it helps students understand the properties and applications of binomial distribution.
GeoGebra Commands & Parameters
Sequence(If[Random[0, 99] > (100 * p), -1, 1], j, 1, 4) → LSequence(Element[L, j], j, 1, n - 1) → SSum(S) → vRotate(fig1, (-α), P) → fig1'Translate(fig1', t) → fig1''BinomialDist(4, p) → B4Histogram({-0.5, 0.5, 1.5, 2.5, 3.5, 4.5}, {n_{CCCC} / N, n_{CCCT} / N, n_{CCTT} / N, n_{CTTT} / N, n_{TTTT} / N}) → BsSum(L) → valTextfield(N) → campoInserimento1
AI Drawing Prompt Reference
Create a simulation of a binomial distribution for 4 Bernoulli trials using coin toss experiments. First, generate a list of 4 random results, each being 1 or -1, then count the number of 1s. Rotate and translate the coin image to show the probability distribution of different outcomes. Finally, draw a histogram to display the frequency of different outcomes.
The prompt above was compiled from the original drawing commands and is for reference only.