
Binomial Distribution - Experimental Results
Loading the math board and drawing, please wait…
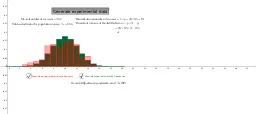
This example demonstrates the experimental results of a binomial distribution, visualizing frequency distributions under varying numbers of trials and success probabilities. Core math concepts include binomial distribution, mean, variance, and bar charts. Constructed using GeoGebra commands Mean and BarChart, with multiple buttons for running experiments. Suitable for high school and above students learning probability and statistics.
GeoGebra Commands & Parameters
Mean(results) → ExperimentalmeanBarChart(-0.5, trials + 0.5, Sequence[((Binomial[trials, k] * prob^(k)) * (1 - prob)^(trials - k)), k, 0, trials]) → theoryBarChart(results, 1, 1 / rerun) → a
AI Drawing Prompt Reference
Create a graph showing experimental results of a binomial distribution with frequency histograms under varying numbers of trials and success probabilities. First, calculate the experimental mean. Then, draw the theoretical distribution histogram. Finally, draw the histogram for experimental results. Make sure to adjust the histogram width and scale for clear data representation.
The prompt above was compiled from the original drawing commands and is for reference only.